This page refers to an older version of the product.View the current version of the online Help.
Rules Analyzer
In this section:
About Rules Analyzer
Standard auditing can be used to track unauthorized application usage or to track when users are overwriting/renaming applications. It is a simple mechanism to use and can function without interaction. The standard auditing mechanism advises you when an application has not, for example, been allowed to execute but does not advise why this was the case. Therefore, an additional tool is required so you can analyze the rules base in real time, and determine exactly why an application is or is not allowed to execute.
Rules Analyzer examines managed endpoints to collect information about how Application Control Rules are applied and provides details of any inconsistencies or inaccuracies in rules as they are processed. Rules Analyzer provides you with a graphical interface that can be used to manually troubleshoot and fine tune Application Control configurations in real time anywhere across the enterprise. All that is required is a network link to a remote Application Control managed endpoint so the Rules Analyzer can connect to the agent software and start logging on the local endpoint.
When the logging has completed you can use the Rules Analyzer to automatically pull the log file across the network back to the computer where the analysis is occurring for investigation. All logging information is held in XML format and each execution request that the Application Control agent processed is listed along with the details of what occurred during processing, including if the process was allowed to execute or not and the reason for the outcome.
The Console
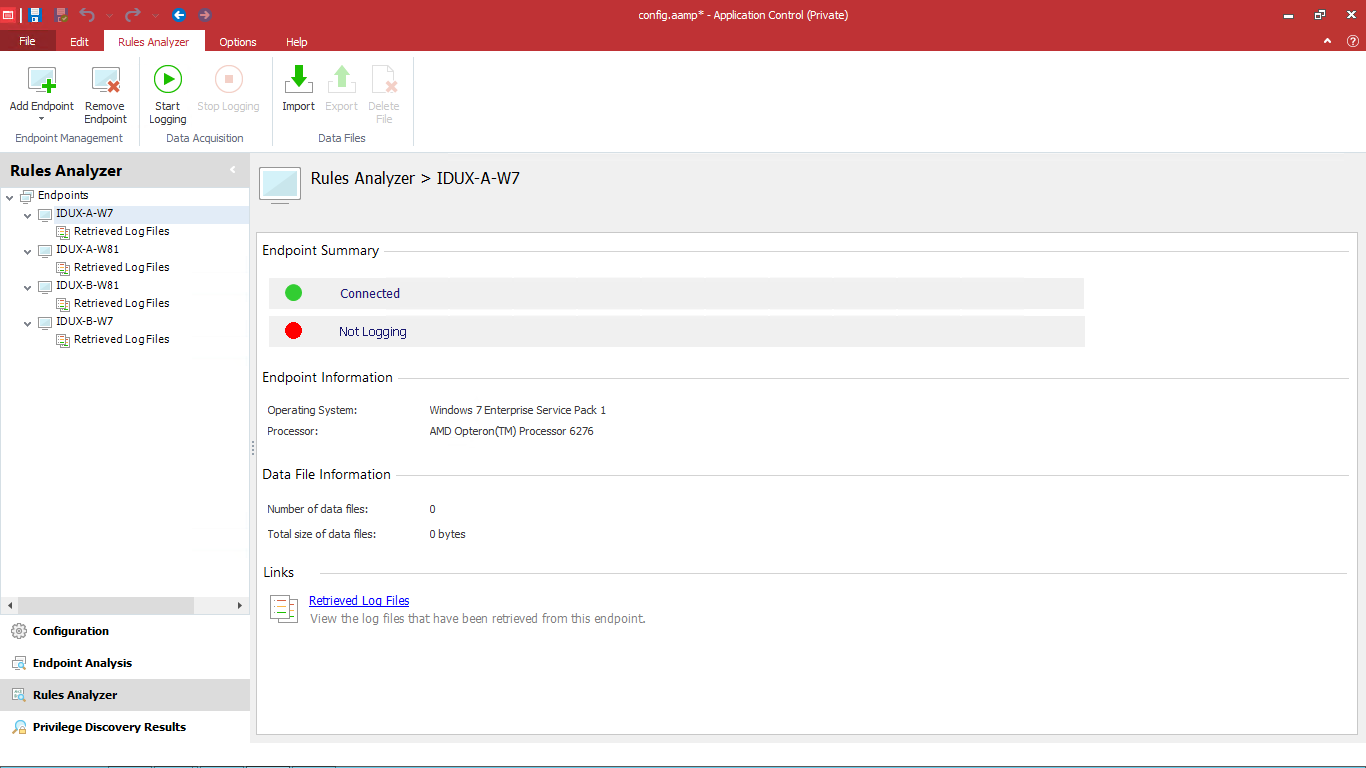
The Rules Analyzer is accessed from the navigation pane within the Application Control console and is used to create, retrieve and examine the log files.
An Endpoint node allows you to control logging on to a specific managed endpoint to retrieve the log files. Below each Endpoint node is a node for each Retrieved Log Files node.
You can review a summary page, view all requests, or view the requests for a specific user. You can restrict the view to the denied or allowed requests. Within the analysis panel you can navigate to a specific request and view the full details of that request, including which rules were applied by Application Control.
You must be logged on with an account that allows read and write access to the registry of any managed endpoint for which you wish to generate logs for using Rules Analyzer, and have read and write access to the local registry of the computer on which the console operates.
Prerequisites
Test that the following are in place:
- On the Start menu select Control Panel.
- Select Administrative Tools.
- Double-click Services.
- Locate the Application Control Agent.
- Launch the Registry Editor on the managed endpoint.
- Locate the license under HKLM\Software\AppSense Technologies\Licensing.
- Configurations are stored in the following location:
-
Navigate to C:\ProgramData\AppSense\ApplicationManager\Configuration.
ProgramData is a hidden folder. Open Windows explorer and type C:\ProgramData in the Address bar. Press Enter to open the folder.
- Open Windows Explorer on the computer that has the Application Control console installed.
- In the Address bar enter \\<computername>\c$ and press Enter. If you can browse the folders, you have access rights. If not, you are prompted for user credentials that allow access.
- Open the Registry Editor on the computer that has the Application Control console installed.
- Select File > Connect Network Registry.
- The Select Computer dialog is displayed.
- Locate the computer and click OK. If you can see the registry keys, you have access.
On remote computers running Windows 7 and above, File Sharing and Remote Registry Service are disabled by default and must be enabled to ensure Rules Analyzer can access or create log files:
- Turn on File Sharing in Start > Control Panel > Network and Sharing Center.
- Start the Remote Registry Service in Start > Control Panel > Administrative Tools > Services.
Set Up Logging for Rules Analyzer
The first requirement is to add an endpoint to the list of endpoints that the Rules Analyzer can interact with. The Rules Analyzer uses the default C$ share to communicate with the agent running on the target machine.
Add an Endpoint
Endpoints must be specified before rules are analyzed.
-
Click the Rules Analyzer navigation button.
The Rules Analyzer navigation tree displays.
- From the Rules Analyzer
ribbon, click Add Endpoint and
select one of the following:
- Browse Deployment Group - The Select Management Server dialog displays. Navigate to the deployment group location and select the required endpoints.
- Browse Domain / Workgroup - The Add Rules Analyzer Endpoints dialog displays. Enter the name or IP address or use the ellipsis (...) in the Computer field to select the required endpoints and click Add.
- The endpoint displays in the Rules Analyzer navigation tree. Once added, an endpoint can be analyzed by the Rules Analyzer.
- To remove an endpoint, highlight it and click the Remove Endpoint button in the Rules Analyzer ribbon.
Start and Stop Logging
- Select the endpoint in the navigation tree.
- Select Start Logging on the Rules Analyzer ribbon.
-
When required, for example, after you have recreated a problem on the endpoint, select Stop Logging on the Rules Analyzer ribbon.
The File dialog is displayed.
- Enter a name for the log file and click OK.
- The XML file is displayed in the navigation tree.
Rules Analyzer files can be large so this feature should only be used when a problem manifests itself and investigation is required.
Once you have created the log files, you can export them or delete them by selecting the files and using the Export and Delete buttons in the Rules Analyzer ribbon.
You can also import log files in XML format by selecting an endpoint and clicking Import in the Rules Analyzer ribbon.
Log Files
All log files for a given computer are stored on the local machine during logging and are temporarily stored in the following location:
C:\Documents and Settings\All Users\Application Data\AppSense\ApplicationManager\Rules Analyzer\RulesAnalyzerLog.xml.
When logging is stopped on the specific endpoint, the log file is closed and transferred to the computer that is running the Rules Analyzer, where it is stored in the cache for the endpoint in question. The cache is held in the following location:
C:\Documents and Settings\All Users\Application Data\AppSense\ApplicationManager\Rules Analyzer\
The naming convention for the files is ComputerName^enteredname. For example, C:\Documents and Settings\All Users\Application Data\AppSense\ApplicationManager\Rules Analyzer\APPUKTECHPUBS2^Regedit.xml.
The computer name is the name of the endpoint as it is entered in the user interface. Therefore, if it is an IP address it is stored as IPAddress^enteredname.xml. The entered name is the name given to the XML file in the Rules Analyzer.
The Rules Analyzer console displays the information regarding execution requests in a number of ways to enable easy access to the details:
The Endpoint Summary page displays when you select a log file node in the navigation tree.
The 2020.3 release of Application Control includes the checkbox to include - or exclude - Overwrite and Rename requests.
In many cases, these requests are generated automatically by background activities within Windows.
The summary shows the number of requests processed by Application Control. The top row of the table shows the total number of requests for all users. The remaining rows show the number of requests for each user. The Total column shows the total number of requests, allowed and denied. The Allowed/Denied column shows the number of allowed or denied requests.
Click on any Total link to display the Log File Contents Request List.
To export the log file in XML format, select Export on the Rules Analyzer ribbon.
You can select View the requests by processing time on the Summary page to display a Request List page showing requests sorted with the longest running request first.
The Request List page displays a list of Application Control requests when you click a Total link in the Summary page.
The requests are listed in the order in which they were processed by Application Control.
Each request listed includes the request Type (v.2020.3 and later), and displays a green tick or red cross indicating whether the request was allowed or denied.
Click on a request link to display the Log File Contents Request Details.
The Request Detail page displays details of a particular request when you click a request in the Request List page.
The Request Detail page displays each rule applied by Application Control in processing the request. The rules are listed in the order applied. The last rule in the list determines the final result – allow or deny. The rule information includes links which, when selected, display popup messages providing an explanation for the rule item.
Use the Return link at the top of the page to navigate to the previous page and the Summary link to return to the Summary page. The Back button on the console toolbar is for navigating the navigation tree.
Rules Analyzer Tasks
Common Rules Analyzer tasks include:
- Analyze a log file - To analyze a log file, select the log file node. The first page shown in the analysis work area is the summary page. You navigate inside the analysis panel by following links. Use the Return link at the top of the page to go back to the previous page.
- View requests for a specific user - To view the requests for a specific user click one of the links in the table on the summary page. You can click in the Total column to see all the requests for the user and you can click in the Allowed column or the Denied column to see only the allowed or denied requests.
- Find requests that take a long time - To find requests that take a long time click View the requests by processing time on the summary page. This shows the requests sorted, with the longest running request first. The processing time shown is the elapsed time taken by the Ivanti Application Control agent to process the request.