File Director
This page refers to an older version of the product.View the current version of the online Help.
File Director dashboards
Monitoring the performance of your File Director cluster is vital in order to identify potential performance issues and manage your appliance proactively.
The ready-made dashboards available from Ivanti Marketplace use your syslog audit stream and the open source ELK Stack software to visualize a range of important metrics. By default, each dashboard comprises a number of components and these are described below.
There are three dashboards available for the 2019.3 File Director release:
•Overview dashboard
Displays statistics for the previous 24 hours. It includes an overview of File Director server data and version information for the platform and clients in use.
•Performance dashboard
Displays statistics for the previous 24 hours. It provides performance metrics to allow you to monitor the overall health of your system.
•User data dashboard
Displays statistics for the previous 24 hours. It provides metrics to show the user data managed by File Director. In the migration of storage or devices, this dashboard enables you to monitor the status of data synchronisation.
For information about how to configure the dashboards further to meet your own requirements, refer to the Elastic Stack website.
Important metrics to monitor
| Metric | Example: |
|
Thread pool usage Each node has a maximum of 400 worker threads available. If the thread pool is fully utilised (all 400 threads are busy) and the number of client connections to this node is greater than 560 (40%) it suggests the node is overloaded. When this threshold is reached, the node will return a failure on the Load Balancer status monitoring API. |
Included in Overview dashboard and Performance dashboard.
|
|
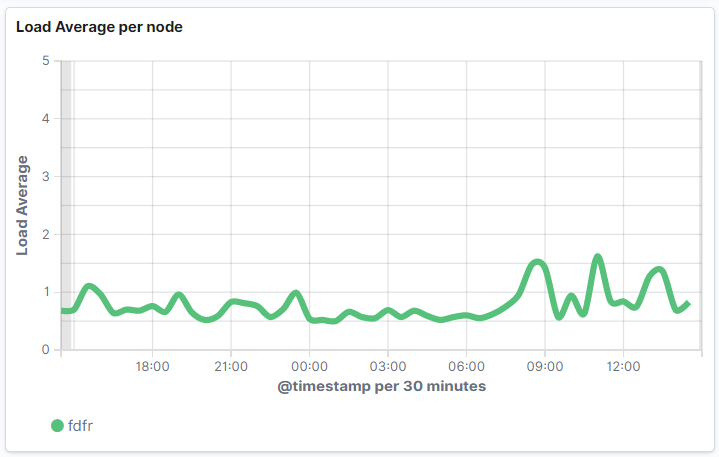
Load average The load average is used to monitor system-wide performance for Linux and Unix platforms. Within the context of this dashboard, a value of 1 means the File Director node is approximately 25% utilized; whereas a value of 4 indicates that the utilization is 100%. If this value remains at 4 (high) on a node for a long period of time, this suggests the node is overloaded and requires investigation. |
Included in Overview dashboard and Performance dashboard.
|
|
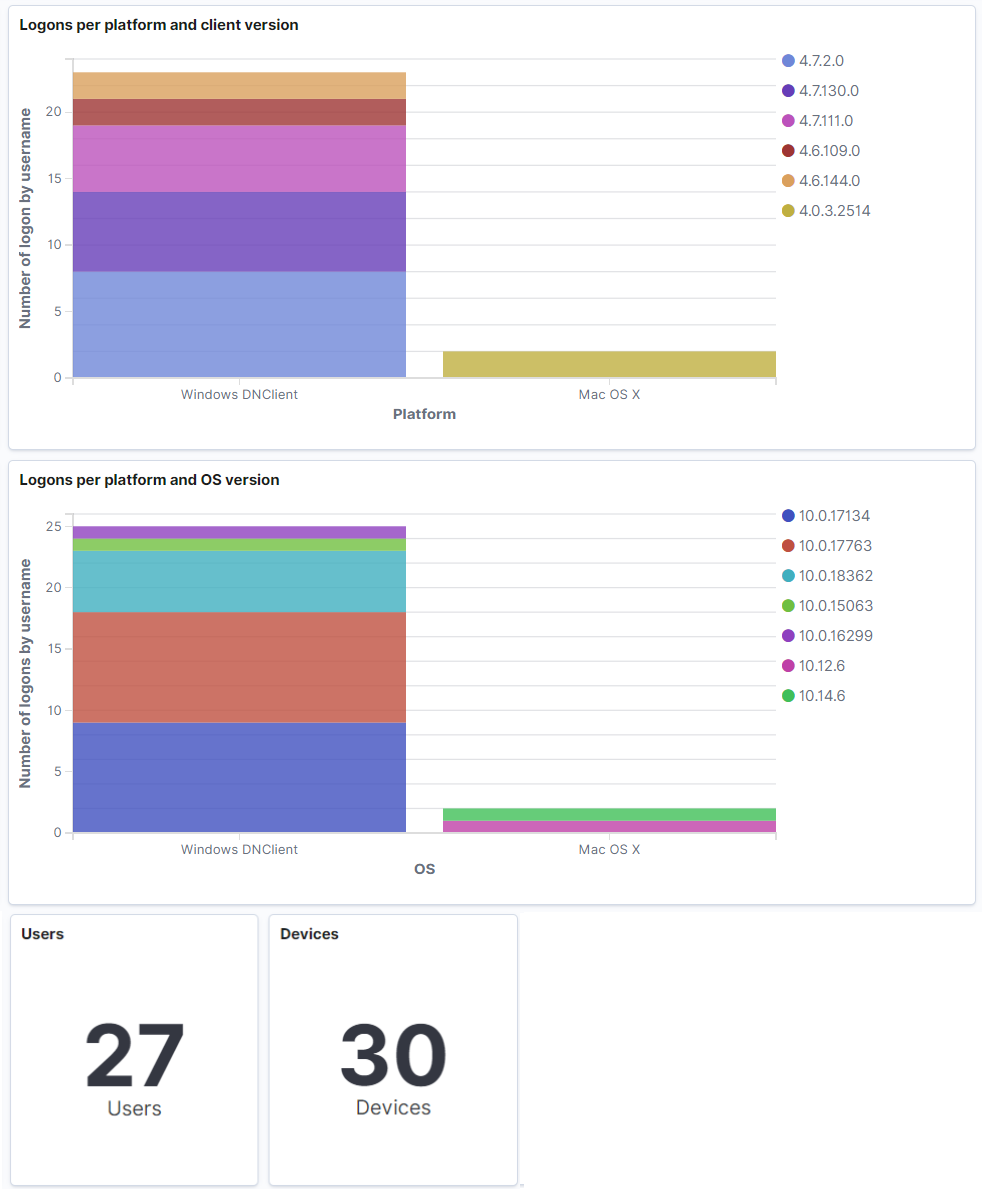
Log in statistics By default, the graph and figures show the number of users and devices that have logged into File Director within the previous 24 hours. This allows you to compare the actual numbers with the numbers you might expect. If there is a large discrepancy this could point to possible issues such as: •File Director server connection / configuration •File Director clients not installed The data also allows you to see the version of the File Director clients in use, and the platforms being used to connect them. |
Included in Overview dashboard.
|
|
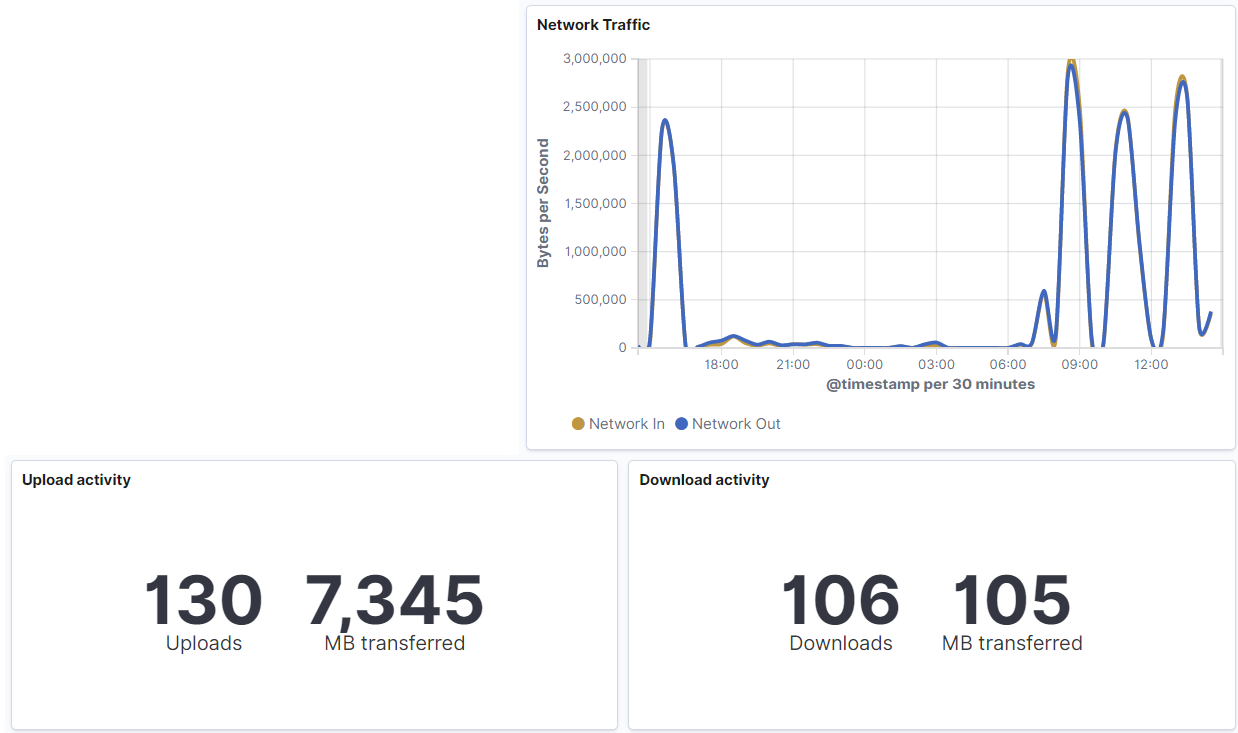
Network and file activity statistics The graph provides you with an overview of File Director node network traffic from the previous 24 hours (in bytes per second). The metrics include how many uploads and downloads have been processed by File Director during this period, and the cumulative size in megabytes. |
Included in Overview dashboard.
|
|
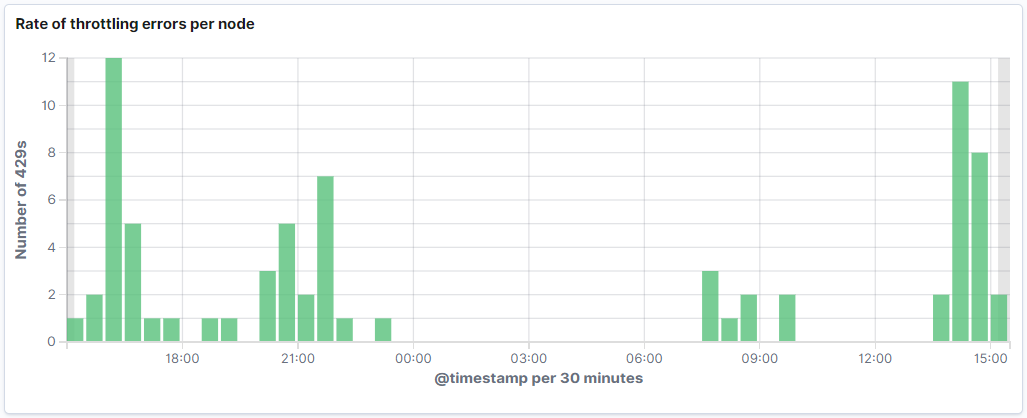
Throttling rate The graph shows the number of throttling responses (or HTTP 429 errors) that have been sent to File Director clients within the previous 24 hours. For example, throttling responses may be sent when: •A third-party cloud service has applied a rate throttling policy to reduce the load on its systems •File Director requests to storage have timed out (this can also be an indication of load on the third-party service). Throttling responses indicate that too many requests have been made to the server within a given time. File Director clients will retry the request after a calculated pause. It is typical to see this throttling rate increase when you onboard new users. If this rate does not decrease over time and you are using cloud connectors, then you should consider: •If using the OneDrive cloud connector, implement multiple application IDs •If using the Google Drive connector, request an increase of the API usage for the connector. If these strategies are not applicable, you should consider reducing the batch sizes when onboarding new File Director users. |
Included in Performance dashboard.
|
|
Cloud connectors response times The graphs show the average response time received from OneDrive and Google Drive respectively. Figures are broken down for each API call made to each third-party. If response times are consistently high, this could suggest the connection between File Director nodes and the cloud service is poor. Most operations should complete within 10s. However, upload related activities can take considerably longer (up to 60s) to complete. |
Included in Performance dashboard.
|
|
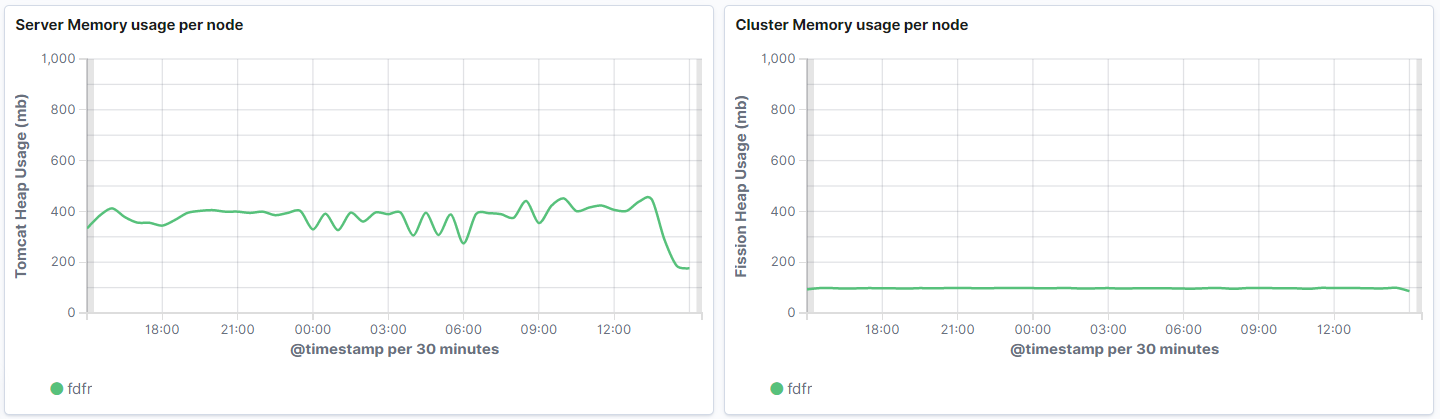
Server and cluster memory usage The graphs indicate memory usage for both the server (Tomcat) and clustering (Fission) services per node. A maximum of 1gb is allocated to each process and under load it is not unexpected that the server memory usage would reach this level. Once the load is reduced the memory usage should also decrease. |
Included in Performance dashboard.
|
|
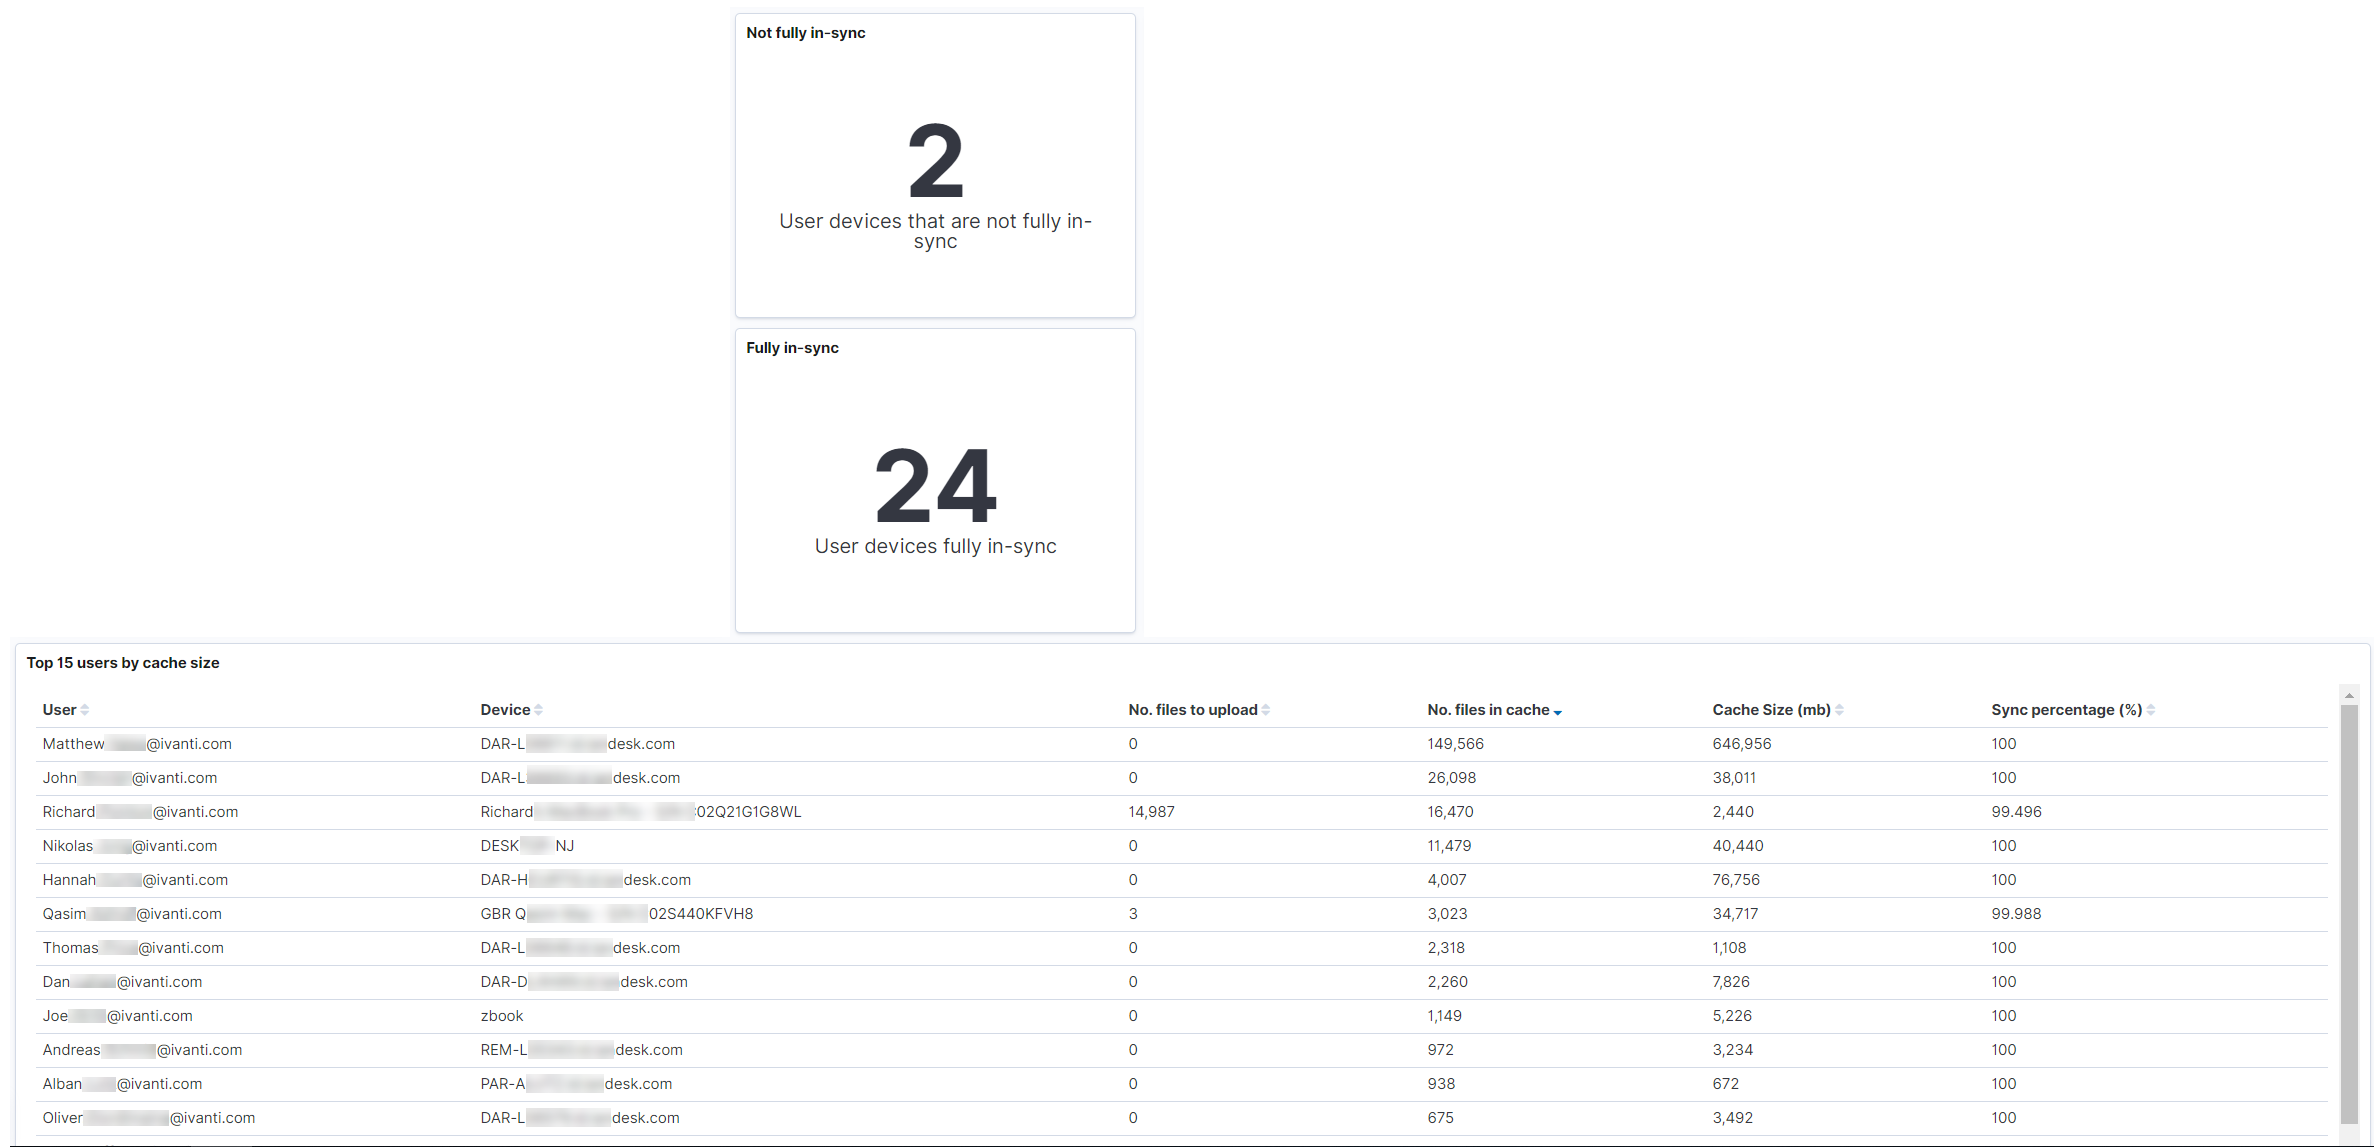
Cache state The data reported provide an overall view of the cache state for File Director desktop clients. Typically, devices log on to the File Director servers every 24 hours. Each time they log on they provide a snapshot of their cache status. This includes the number of files in the cache, the size of these files, and how many files there are to upload. These measures can then be used to provide a percentage value for the files that are in synchronisation - and determine whether a device is fully in-sync or not. When a device is fully in-sync, all files are backed up and the machine is ready to be upgraded or replaced. If the device is not fully in-sync there is the potential for data loss if a migration were to be performed. |
Included in User Data dashboard.
|
|
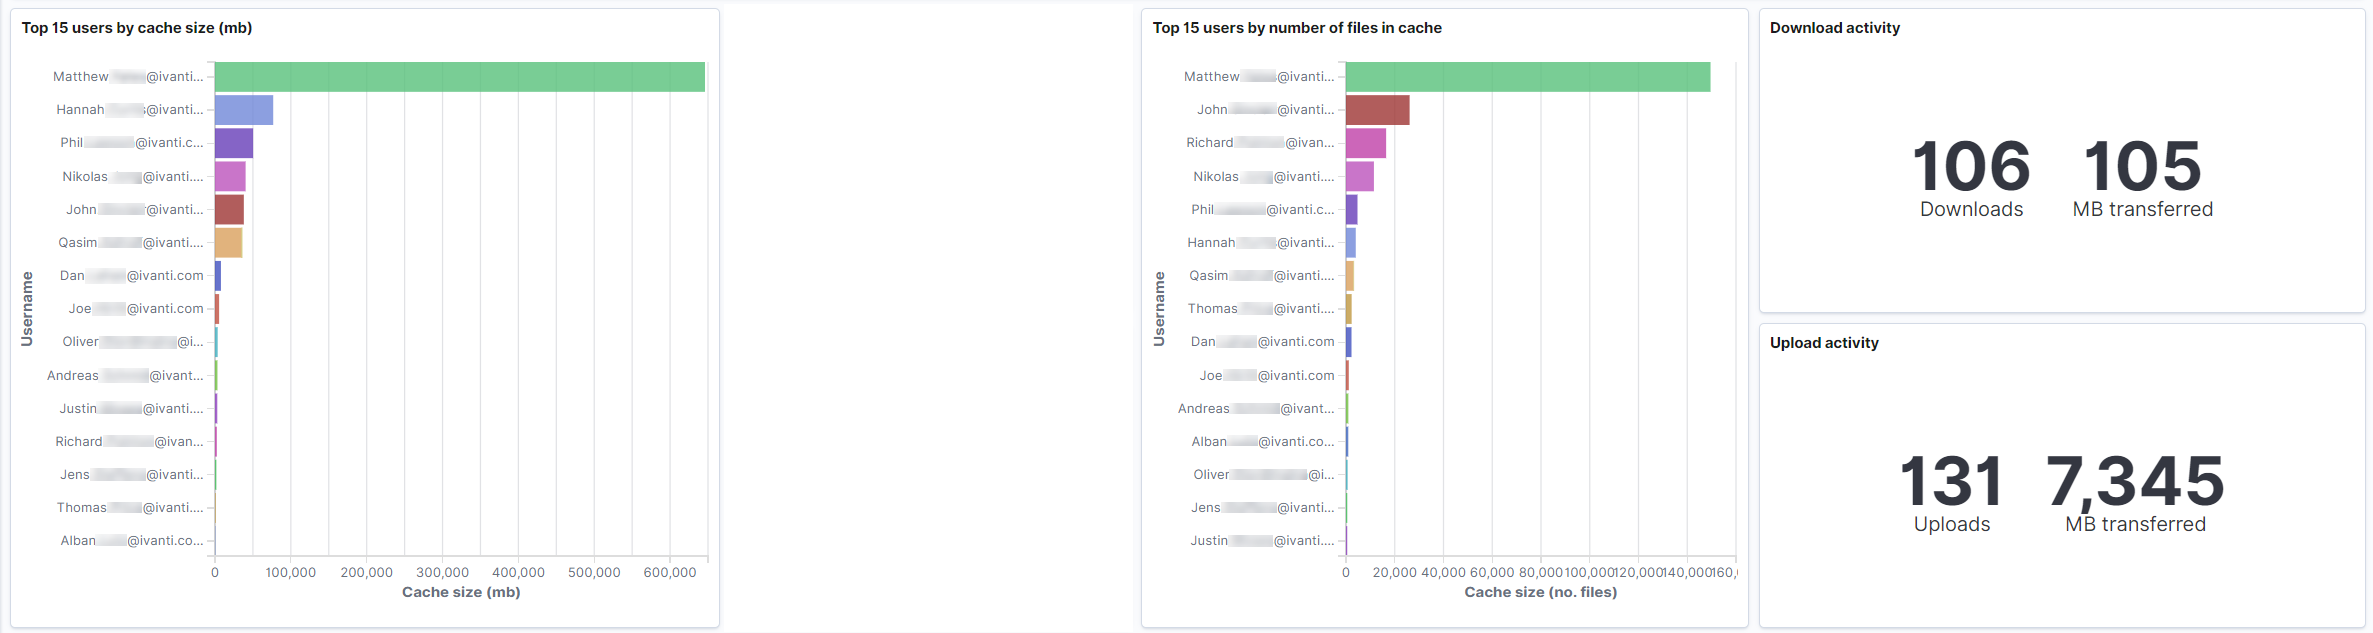
File Activity and Cache statistics The statistics show upload and download activity within the last 24 hours. The default graphs show users with the largest cache, both in terms of the number of files and size of those files (megabytes). This information can help you plan storage capacity prior to onboarding, especially when used in conjunction with the AdminPause feature available for Windows clients (see File sync controls for further information). |
Included in User Data dashboard and Overview dashboard.
|