File Director dashboards
This section includes
Monitoring the performance of your File Director cluster is vital to identify potential performance issues and manage your appliance(s) proactively.
The ready-made dashboards available from Ivanti Marketplace use your syslog audit stream and the open source Elastic Stack (formerly ELK Stack) or Splunk software to visualize a range of important metrics. By default, each dashboard comprises a number of components and these are described below. Each dashboard is preconfigured to display relevant data. However, users are encouraged to customize and develop these reports to meet your own requirements.
Note that dashboards are periodically updated. Depending upon the release of dashboards accessed, the default panel arrangement may vary.
Useful links:
•Ivanti Marketplace links:
•File Director Dashboards - Elastic Stack
•File Director Dashboards - Splunk
•Refer to the Elastic Stack website for information about how to configure the dashboards further to meet your own requirements.
•Ivanti Community article: Monitoring File Director with Splunk
Dashboards available
The following dashboards are available for File Director 2019.3 and later:
Although the appearance of your dashboard will depend upon the visualization tool used, the differences are in their styling - not in their substantive content. Illustrations within this topic use Elastic Stack unless specifically stated otherwise.
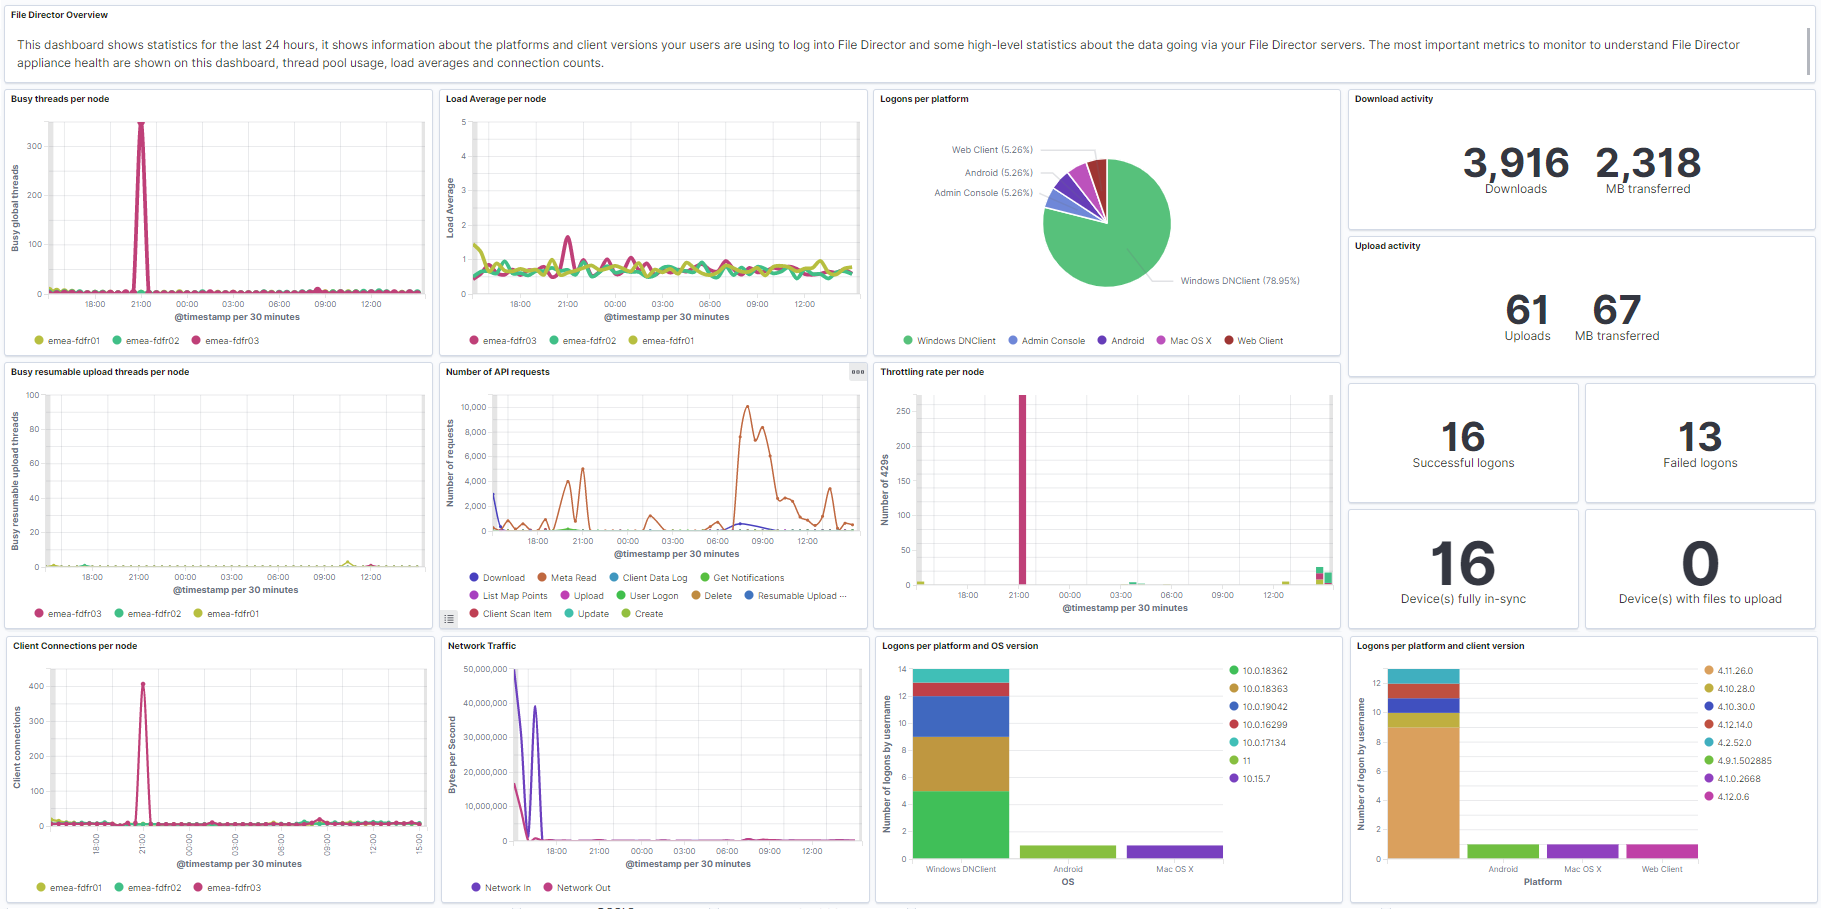
•Overview dashboard
Displays statistics for the previous 24 hours. It includes an overview of File Director server data including thread pool usage, load averages and connection counts, plus data regarding the platform and clients in use.
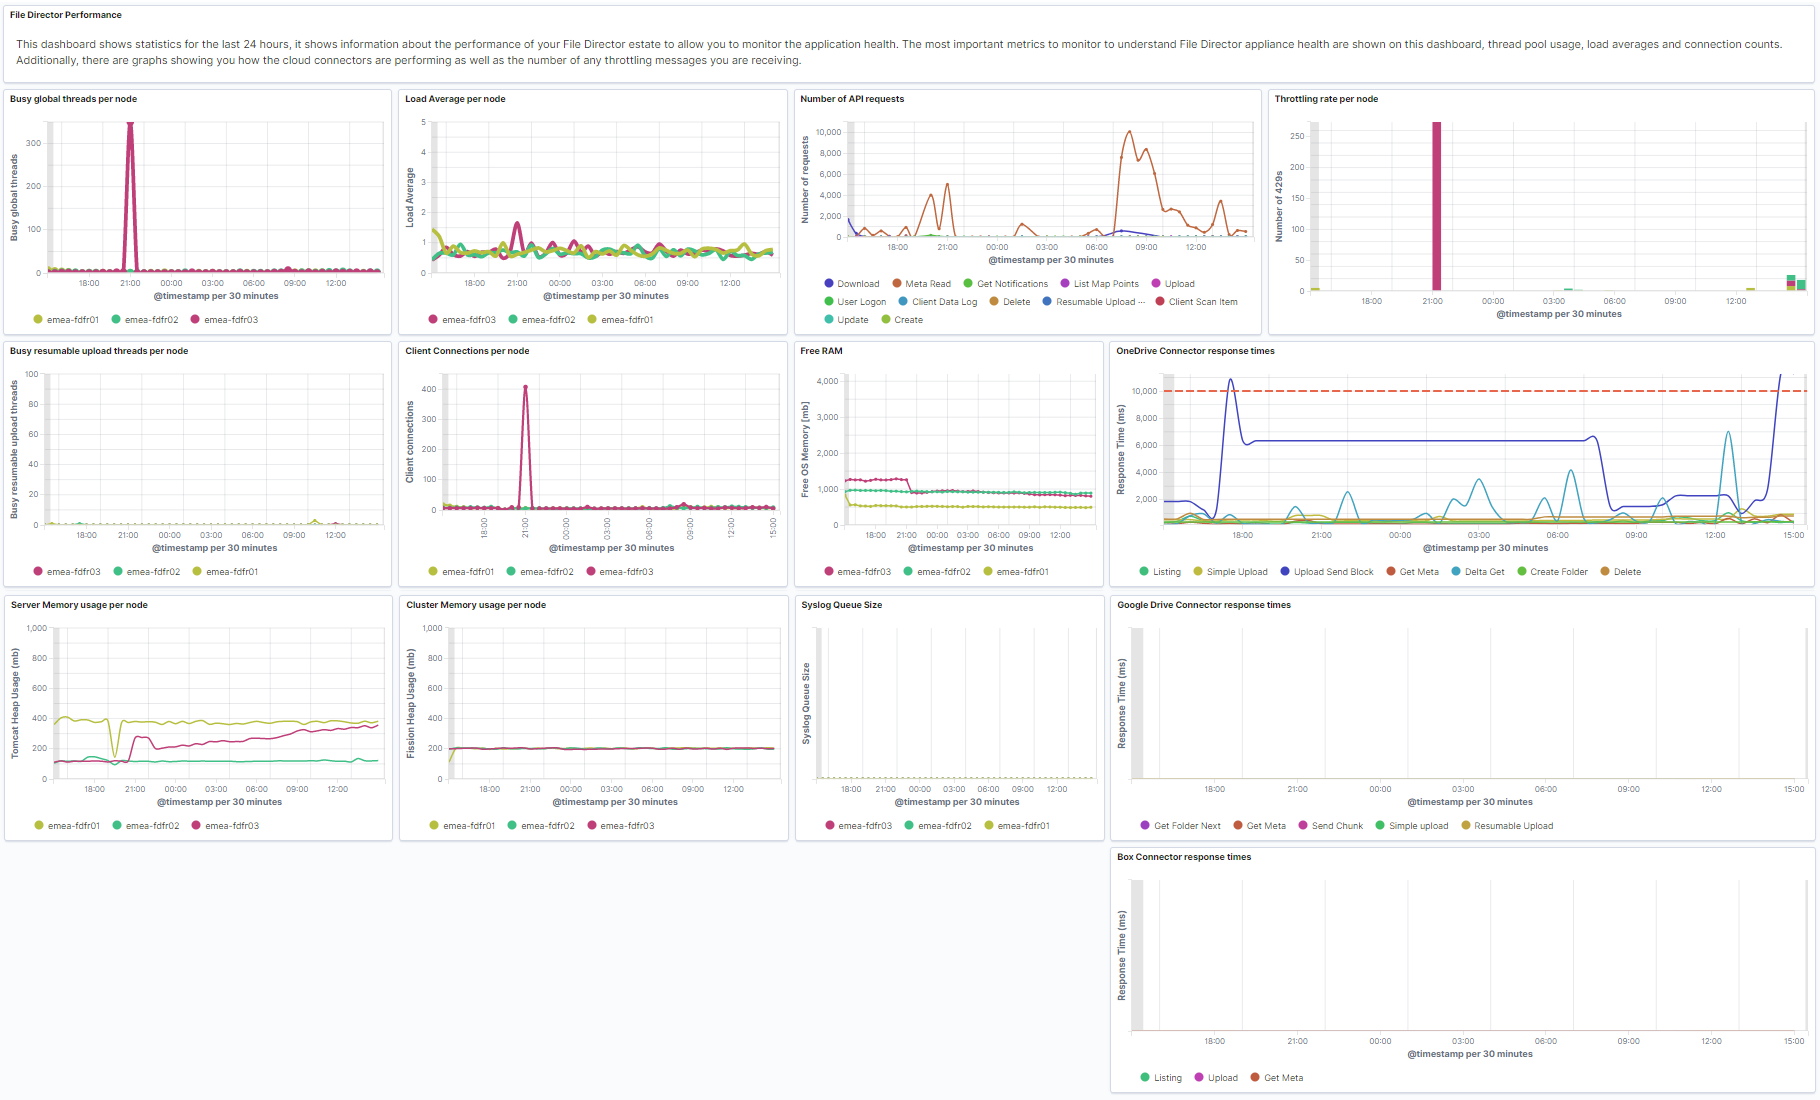
•Performance dashboard
Displays statistics for the previous 24 hours. It provides performance metrics to allow you to monitor the overall health of your system. Data includes thread pool usage, load averages and connection counts, cloud connector performance and memory usage.
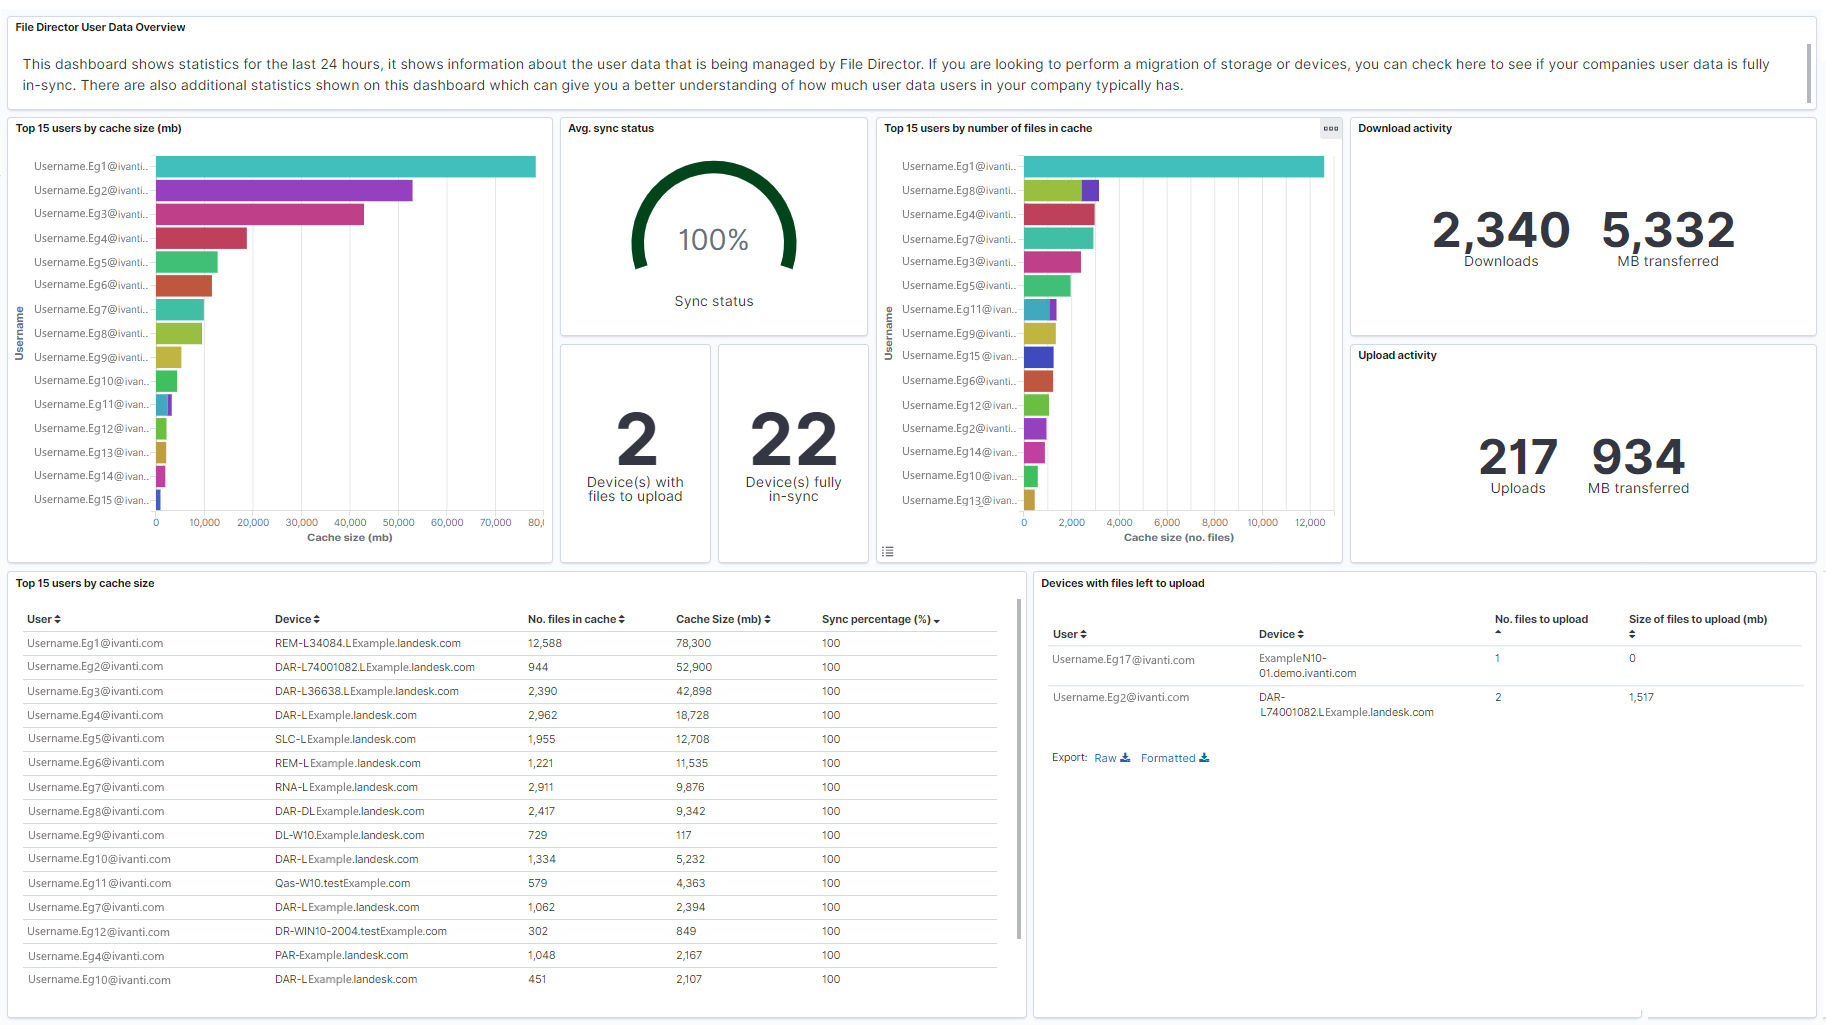
•User data dashboard
Displays statistics for the previous 24 hours. It provides metrics to show the user data managed by File Director. In the migration of storage or devices, this dashboard enables you to monitor the status of data synchronisation.
The following dashboard is available for File Director 2020.3 and later:
•File Discovery dashboard
Displays data from the Outside of Profile scan. The dashboard includes metrics from both the default scan summary report, and, if enabled, the optional detailed report. The dashboard enables you to identify file types and file locations outside of the user profile that may be of interest to you and warrant further scrutiny.
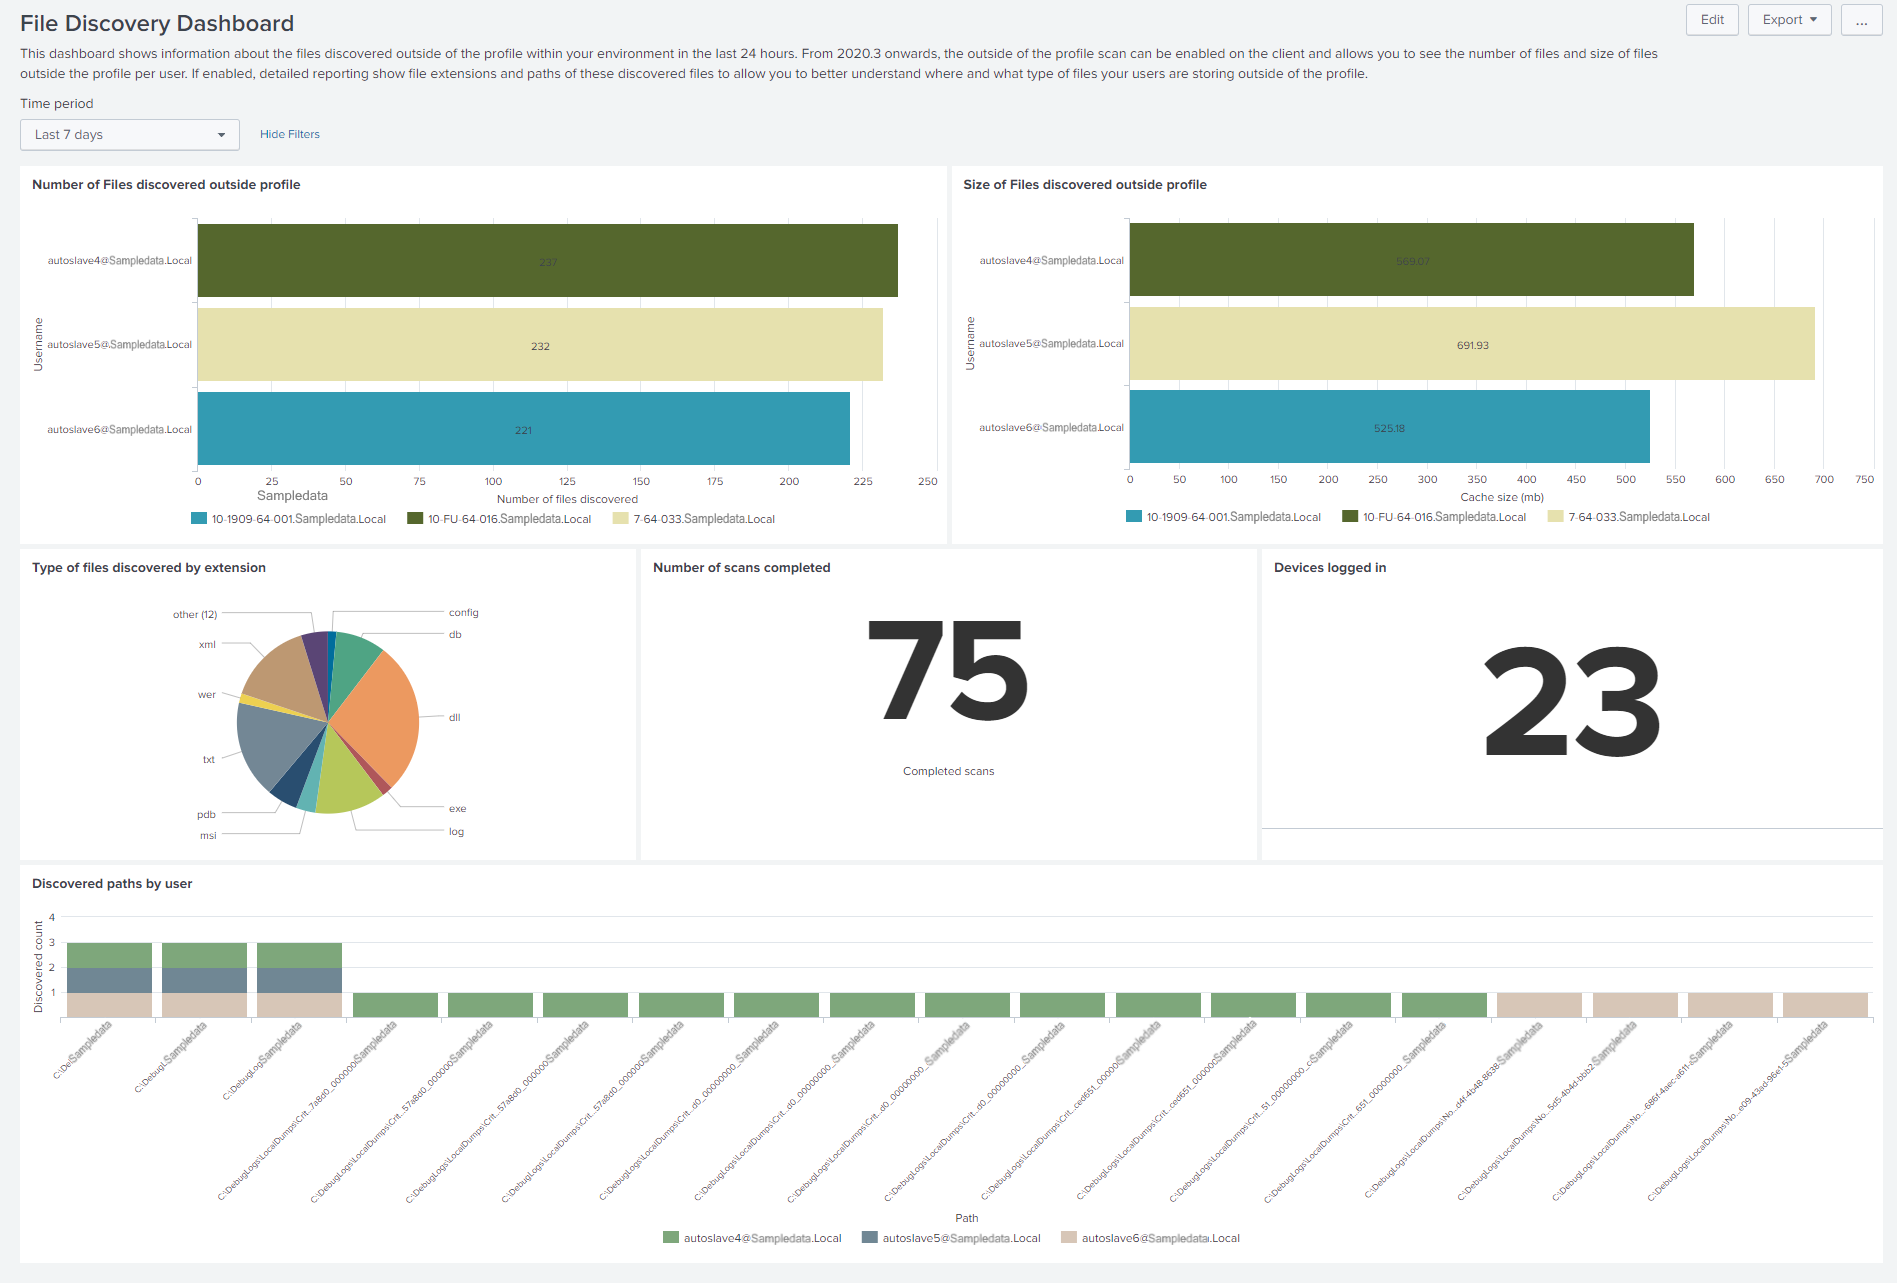
Illustration of File Discovery dashboard visualized using Splunk
View and export data
Specific graphs may comprise multiple pages and only the first page is immediately visible. Further pages can be viewed, and/or the data exported.
|
Visualization Tool |
Description |
Icon |
|---|---|---|
| Elastic Stack |
View data
Export data
|

|
| Splunk |
Tool icons are displayed whenever focus is applied to a graph. They enable the following actions: Search
Export
Inspect (view) Refresh
|
|
Important metrics to monitor
|
Metric |
Example |
|---|---|
|
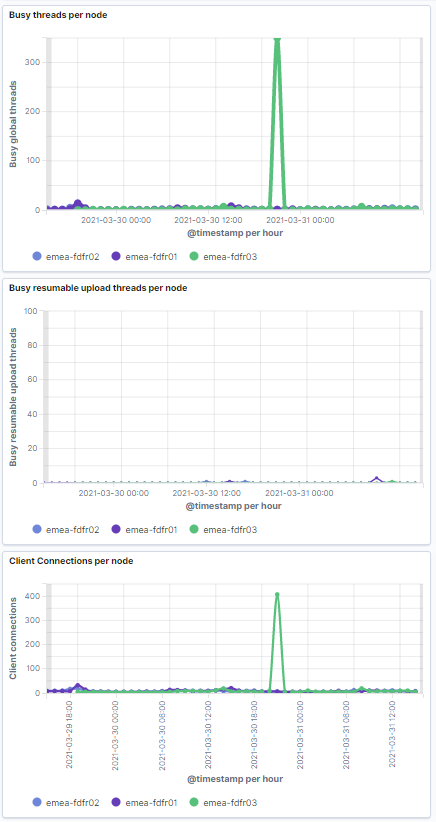
Busy threads per node Each node has a maximum of 400 worker threads available. If the thread pool is fully utilised (all 400 threads are busy) and the number of client connections to this node is greater than 560 (40%) it suggests the node is overloaded. Note that when this threshold is reached, the node will return a failure on the Load Balancer status monitoring API. |
Included in Overview dashboard and Performance dashboard.
|
|
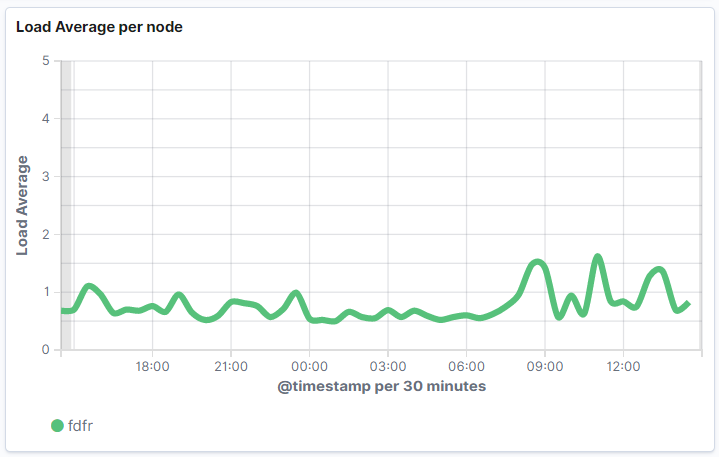
Load average The load average is used to monitor system-wide performance for Linux and Unix platforms. Within the context of this dashboard, a value of 1 means the File Director node is approximately 25% utilized; whereas a value of 4 indicates that the utilization is 100%. If this value remains at 4 (high) on a node for a long period of time, it suggests the node is overloaded and requires investigation. |
Included in Overview dashboard and Performance dashboard.
|
|
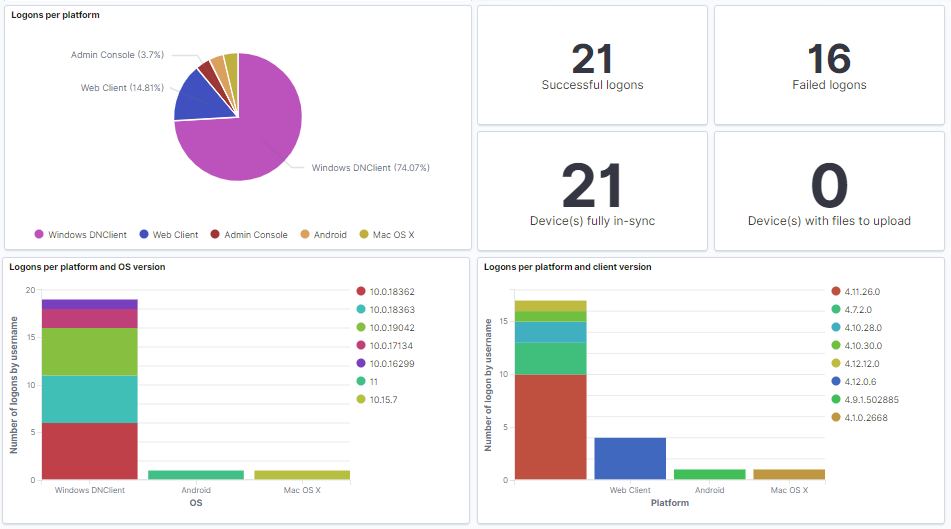
Log in statistics By default, the graph and figures show the number of users and devices that have logged into File Director within the previous 24 hours. This allows you to compare the actual numbers with the numbers you might expect. If there is a large discrepancy this could point to possible issues such as: •File Director server connection / configuration •File Director clients not installed The data also allows you to see the version of the File Director clients in use, and the platforms being used to connect them. |
Included in Overview dashboard.
Illustration example shows a customized grouping of the logon panels |
|
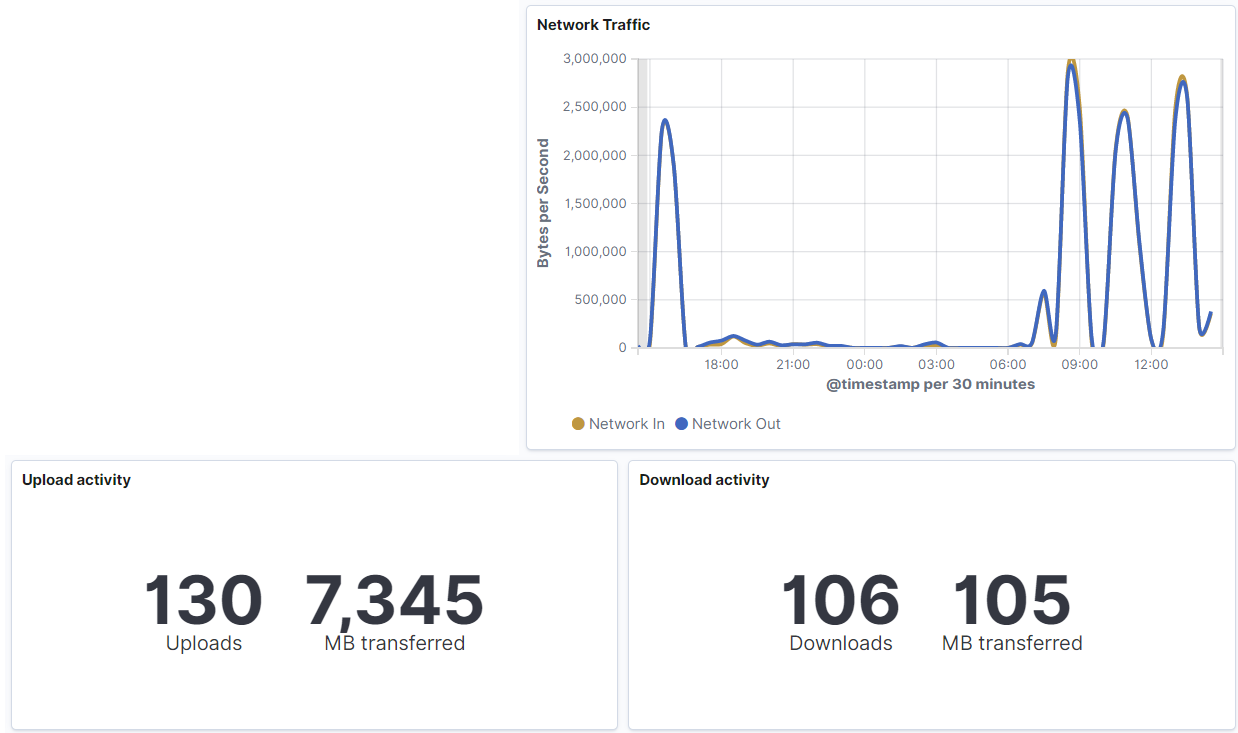
Network and file activity statistics The graph provides you with an overview of File Director node network traffic from the previous 24 hours (in bytes per second). The metrics include how many uploads and downloads have been processed by File Director during this period, and the cumulative size in megabytes. |
Included in Overview dashboard.
|
|
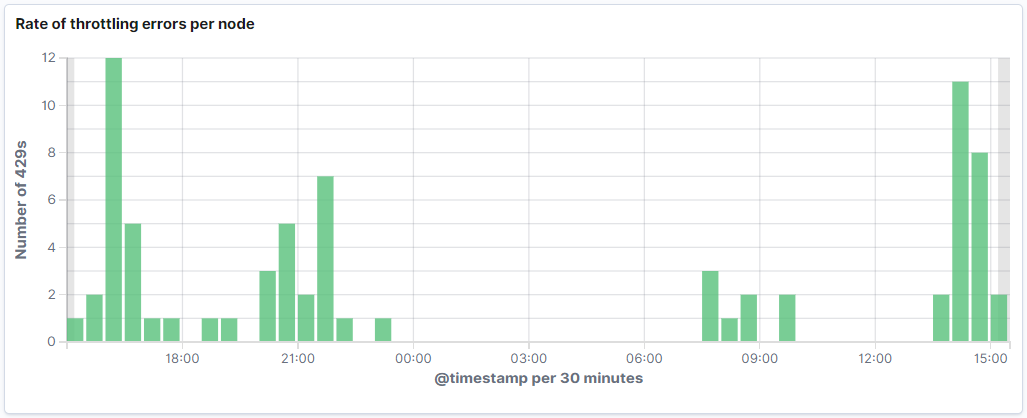
Number of throttling errors per node The graph shows the number of throttling responses (or HTTP 429 errors) that have been sent to File Director clients within the previous 24 hours. For example, throttling responses may be sent when: •A third-party cloud service has applied a rate throttling policy to reduce the load on its systems •File Director requests to storage have timed out (this can also be an indication of load on the third-party service). Throttling responses indicate that too many requests have been made to the server within a given time. File Director clients will retry the request after a calculated pause. It is typical to see this throttling rate increase when you on-board new users. If this rate does not decrease over time and you are using cloud connectors, then you should consider: •If using the OneDrive cloud connector, implement multiple application IDs •If using the Google Drive connector, request an increase of the API usage for the connector. If these strategies are not applicable, you should consider reducing the batch sizes when on-boarding new File Director users. |
Included in Performance dashboard.
|
|
Cloud connectors response times The graphs show the average response time received from OneDrive, Google Drive and Box connectors respectively. Figures are broken down for each API call made to each third-party. If response times are consistently high, this could suggest the connection between File Director nodes and the cloud service is poor. Most operations should complete within 10s. However, upload related activities can take considerably longer (up to 60s) to complete. |
Included in Performance dashboard.
|
|
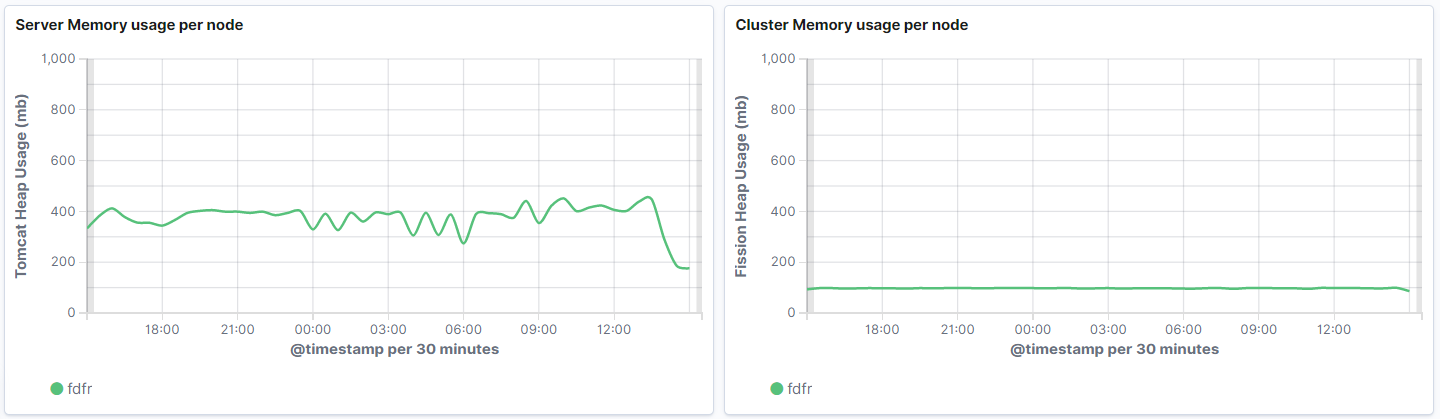
Server and cluster memory usage The graphs indicate memory usage for both the server (Tomcat) and clustering (Fission) services per node. A maximum of 1 GB is allocated to each process and under load it is not unexpected that the server memory usage would reach this level. Once the load is reduced the memory usage should also decrease. |
Included in Performance dashboard.
|
|
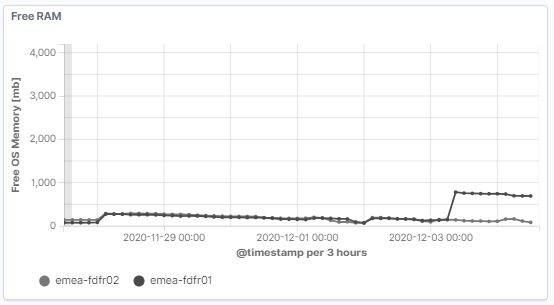
Free RAM The metric provides an overall view of the RAM available for the appliance - as opposed to any individual process |
Included in Performance dashboard.
|
|
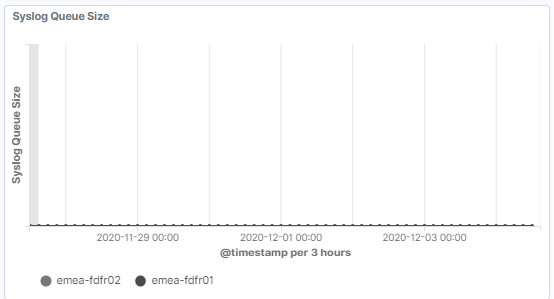
Syslog Queue Size The metric will typically display very little or no data. However, a sudden or noticeable increase in data could alert you to emerging issues and/or prove useful in troubleshooting any problems discovered. |
Included in Performance dashboard.
|
|
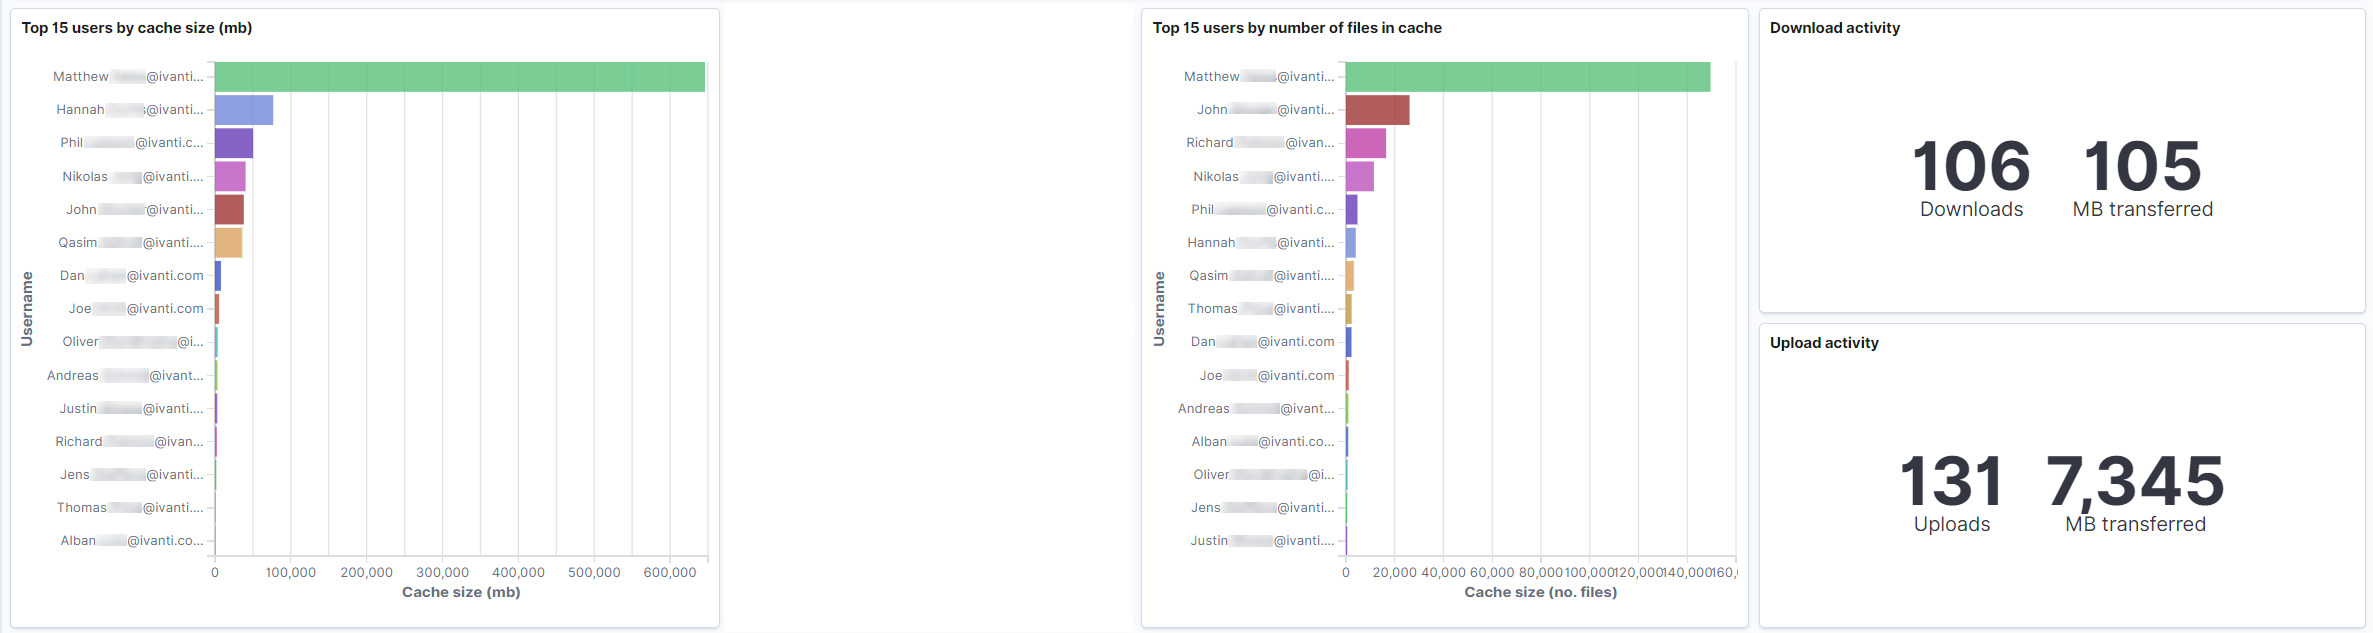
File Activity and Cache statistics The statistics show upload and download activity within the last 24 hours. The default graphs show users with the largest cache, both in terms of the number of files and size of those files (megabytes). This information can help you plan storage capacity prior to on-boarding, especially when used in conjunction with the AdminPause feature available for Windows clients (see File sync controls for further information). |
Included in User Data dashboard and Overview dashboard.
|
|
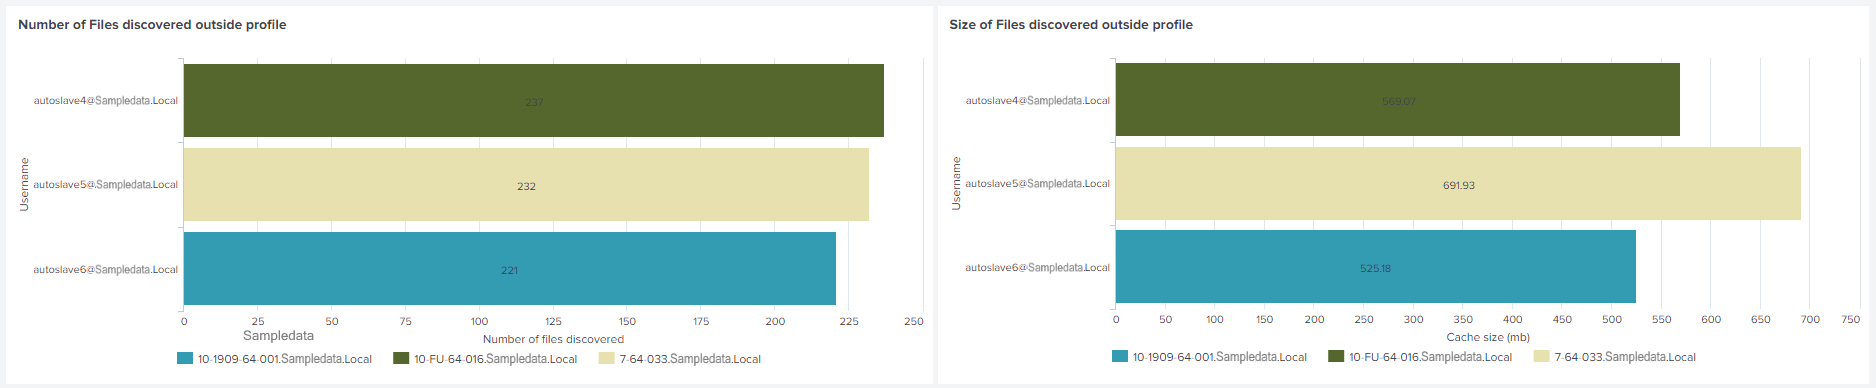
Files discovered outside of profile The metric displays the number and total size of files identified by the Scan outside of Profile. Each bar within the graph represents data from one scan per user (or device). The data visualized is provided by the default scan report (the scan summary). |
Included in File Discovery dashboard.
Illustration visualized using Splunk |
|
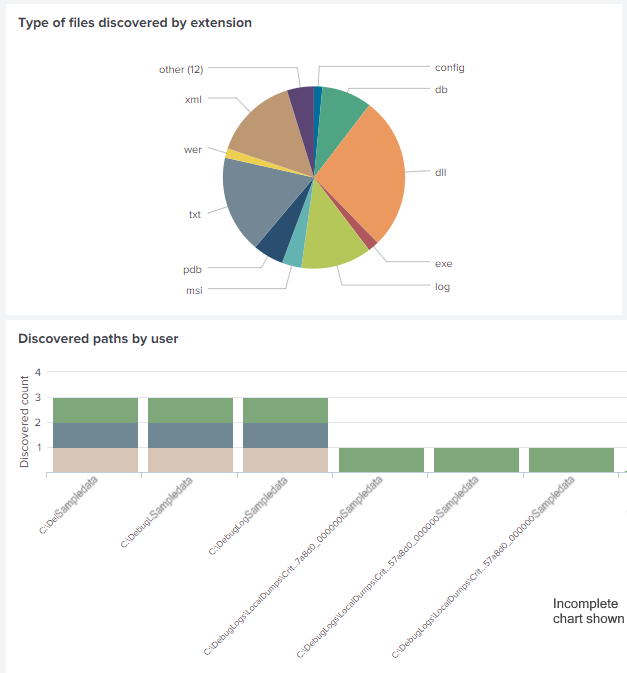
Files discovered If the detailed report has been enabled for the Scan outside of user profile, details of discovered files are visualized. This includes files discovered by extension which enables you refine and configure further scans. For example, you may identify certain file types you wish to ignore, and exclude them from further scans. Discovered paths by user data identifies file locations for each user across all devices. Again, the data may inform further configuration of user scans that you wish to perform. |
Included in File Discovery dashboard.
Illustration visualized using Splunk |