Create a query
Use the Event Viewer to create custom queries.
-
From the console ribbon, select Manage > Event Viewer to display the Application Control Events dialog.
-
Select Manage Connections to open the Management Server Database Connection dialog.
Use the connection details used by AppSense in Enterprise mode to store and deploy configurations via Ivanti Management Center. Your user profile saves database connection details and lists them here. To add or modify a Management Center connection, refer to Create Management Center connection below.
-
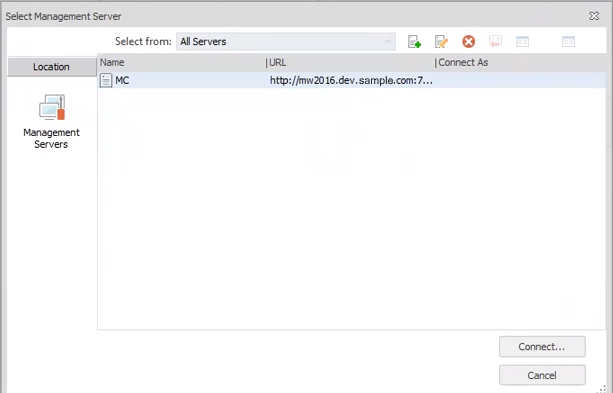
From the Select Management Server dialog, select the connection required, then select Connect to open the user connection dialog.
-
In the User Connection dialog select the options required:
Connect as
-
Current User: Select this option to connect using your current user profile.
-
Custom User: Select this option to connect using an alternative user profile.
The user profile you select must have the appropriate permissions to access Management Center.
-
Remember me: Select or clear this checkbox as required.
-
-
Select OK to save connection credentials and establish the connection.
-
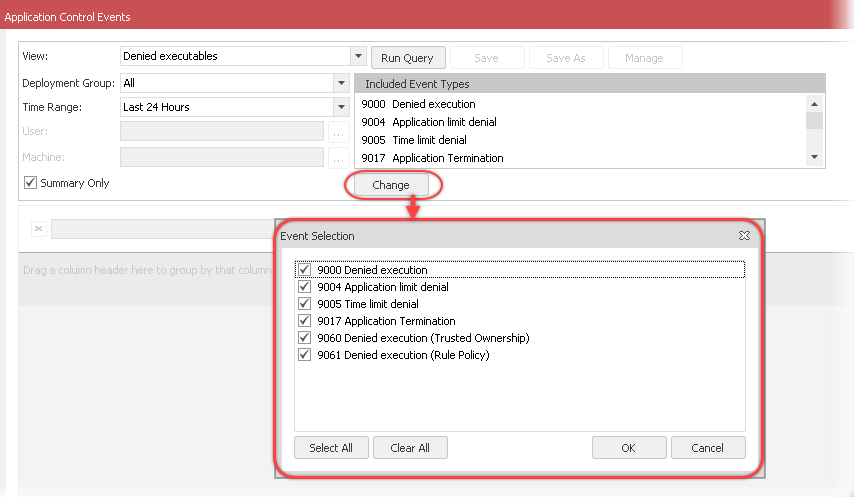
In the View field, select the view required from the list.
The list contains pre-configured views and previously saved customized views. Each view represents a category of event(s) you can query. Each view returns results based on the corresponding event IDs.
Pre-configured views include:
-
Denied Executables
-
Allowed Executables
-
Policy Change Requests
-
Policy Change Executables
-
Privilege Management
-
Privilege Discovery
-
Privilege Discovery (Windows Executable Components)
-
Self Authorization
-
Self Elevation
-
UAC Replacement
-
Browser Control
Most views return only single event types. For example, Privilege Management lists when application privileges are changed (event ID 9018). Other views return a number of event types. For example, Denied Executables displays events recording denied execution, application limit denial, time limit denial, application termination, denied execution (using trusted ownership), and denied execution (using rule policy).
-
Change event types included
When multiple event IDs are included, administrators can modify and reduce the list if required:
-
Select Change. The Event Selection dialog lists all events included in the view.
-
Select or clear the checkbox for each event as required, then select OK.
Certain queries return a large amount of data and take considerable time to run, especially if your database is very large. Use filters such as Time Range, Deployment Group, User, or Machine. Select Summary Only where applicable. Using filters and summaries limits the data returned and improves run time for the query.
-
In the Deployment Group field, select the group required from the list. The deployment groups listed are those defined in the Management Center at the time of your database connection.
If you have added or deleted groups in your current session, reconnect to the Management Center to update the groups listed.
-
Select the specific deployment group required. You also can select:
-
All: Returns events from all deployment groups defined
-
(Default): Returns events from the default deployment group as defined in the Management Center.
-
-
Select the period required from the Time Range list or select <Specify custom period> and in the Custom Time Range dialog, enter a start and end time for the time range required, and select OK.
-
Select or clear the Summary Only checkbox.
The Summary Only option groups similar events and provides total occurrences and user counts for all instances identified. Summaries allow an administrator to see which events are recurring and by how many users. For example, it identifies files that have been blocked most frequently, or applications that have been allowed. The Summary Only view ignores user and machine-specific data, providing numbers of instances only. It is available for allowed and denied executable queries only.
With the Summary Only checkbox cleared, the query will return all event data as a simple grid without values for total or user count.
-
Select the ellipsis next to the User field to open the Select User dialog and filter the query by user. Use this option to filter your query results for reported user issues or requests. Add a time range to further filter results. The query returns only the events raised for the user and time range selected.
The User field is not available if the Summary Only checkbox is selected.
-
Enter the domain and user name.
ivanti/example.username -
To search for a user:
-
-
To search for a specific machine, select the ellipses next to the Machine field, and select the machine required. You also can enter an exact match for the machine domain and name directly.
The Machine field is not available if the Summary Only checkbox is selected.
-
Select Run Query. If you change the view or filters, re-run the query to update the results.
The Event Viewer shows a maximum of 10,000 events. If the query retrieves more than 10,000 events, reduce the time window to limit returned events.
Environment variables
Application Control normalizes absolute file paths for executables identified in events. It substitutes standard environment variables for certain user or machine-specific values. This means that when the same file is accessed by different users and/or on different machines, the normalized path shows this as identical.
Example:
|
Absolute paths |
Normalized path |
|---|---|
|
C:\ProgramData D:\ProgramData |
%programdata% |
|
C:\users\test\desktop\test.exe |
%userprofile%\desktop\test.exe |
Create Management Center connection
-
From the Select Management Server dialog, click the Add icon.
-
In the Add Server dialog, enter connection details for the Management Center:
These details are determined when the Management Center is configured. Refer to About Management Center or to your system administrator.
-
Friendly name: The 'friendly' or more descriptive name for the server required.
-
Select Server
-
Protocol: Select http or https.
-
Server name: Enter or select the Management Center server name.
-
Port: The port used for connections to the Management Center.
-
-
Full URL: The full URL for the Management Center server.
-
-
Select Add to save the connection and list it in the Select Management Server dialog.


