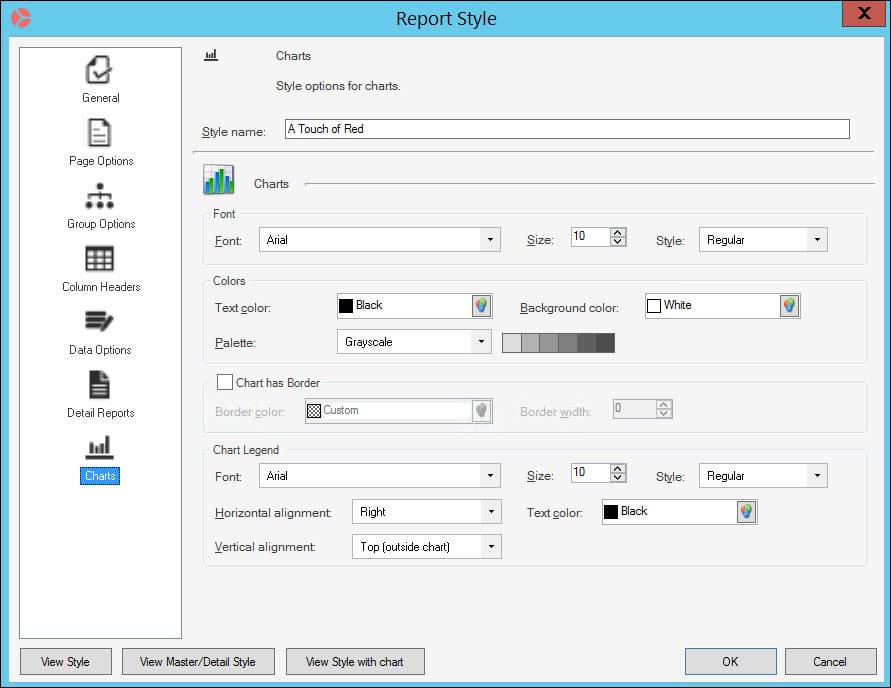
Define Chart Options for Report Styles
Use the Charts page to define the following properties of charts used within the Report:
- Font: Font type, size, and style.
- Colors: Text color, background color, and color palette.
- Chart has Border: Border color and width.
- Chart Legend: Font type, size, style, alignment, and text color.
To define the chart properties for Report Styles:
- Open the Report Style Window to edit a Report Style or create a New Report Style.
- Click
Charts in the Report Styles window.
- Define the Font settings:
- Font type (example: Microsoft Sans Serif)
- Font size (example: 22)
- Font style (bold, bold italic, italic, regular)
- Define the Color settings:
- Text color
- Background color for the chart
- Palette: There are many color palette choices in the Palette drop-down menu. When you select a specific palette, the colors are shown to the right of the drop-down menu.
- Select the
Chart has borders check box to add a border to
the chart, then:
- Define the Border color.
- Define the Border width by specifying
a number or clicking the
incremental arrows
 to change the border width value.
- Define the Chart Legend settings:
- Font type (example: Microsoft Sans Serif)
- Font size (example: 10)
- Font style (bold, bold italic, italic, regular)
- Legend's vertical and horizontal alignment (middle, bottom, and top right, left, and centered)
- Text color
- Click View Style with chart to preview an example Report containing a chart at any time.
- Click OK to save and close the Report Style.