Define Slices for a Doughnut/Pie Chart Widget
Use the Slices page (accessed from within the Chart Series window) to define the values to display in the Doughnut/Pie Chart Widget. Each value will be a slice. Properties include:
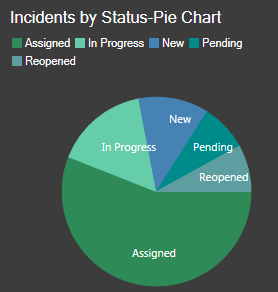
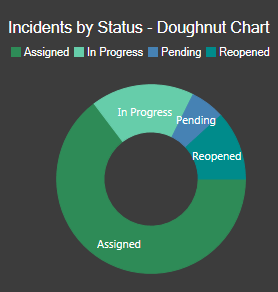
- Field Name: Field whose values will be displayed as slice in the pie chart (example: Status Field—values might be New, Assigned, In Progress, etc.).
- Lookup Sorting: The Lookup Table and Field values to use for sorting
the values of slices.
 Note: The Chart Series window is accessed from within the Widget Manager when you create or edit a Chart Widget, and then add a Series.
Good to know:
- Fields in the Field Name drop-down are limited to the Widget's selected Field Type (example: Date/Time, Number, Text, or Logical).
To define slices for a Doughnut/Pie Chart Widget:
- Create a Chart Widget.
- In the Chart Series window, click the Slices page.
- Select the Field and values to display as slices:
- Field name: Select the Field whose values will be displayed as slices in the doughnut/pie chart (example: Status values—New, Assigned, In Progress, etc.).
- Define lookup sorting properties for the values of the slices:
- Lookup Table: Select a Lookup Table to use to sort values for the series.
- Source Field: Select a Source Field from the Lookup Table. Only Fields that are of the same type as the Field Name selection are shown.
- Target Field: Select a Target Field from the Lookup Table. Only
Fields that are of the same type specified in the
x-axis sorting
options are shown.
Note: If a value from a Source Field matches the value of a slice in the series, the value from the Target Field for that record is used. Otherwise, the slice value is used as-is.
-
Select OK.