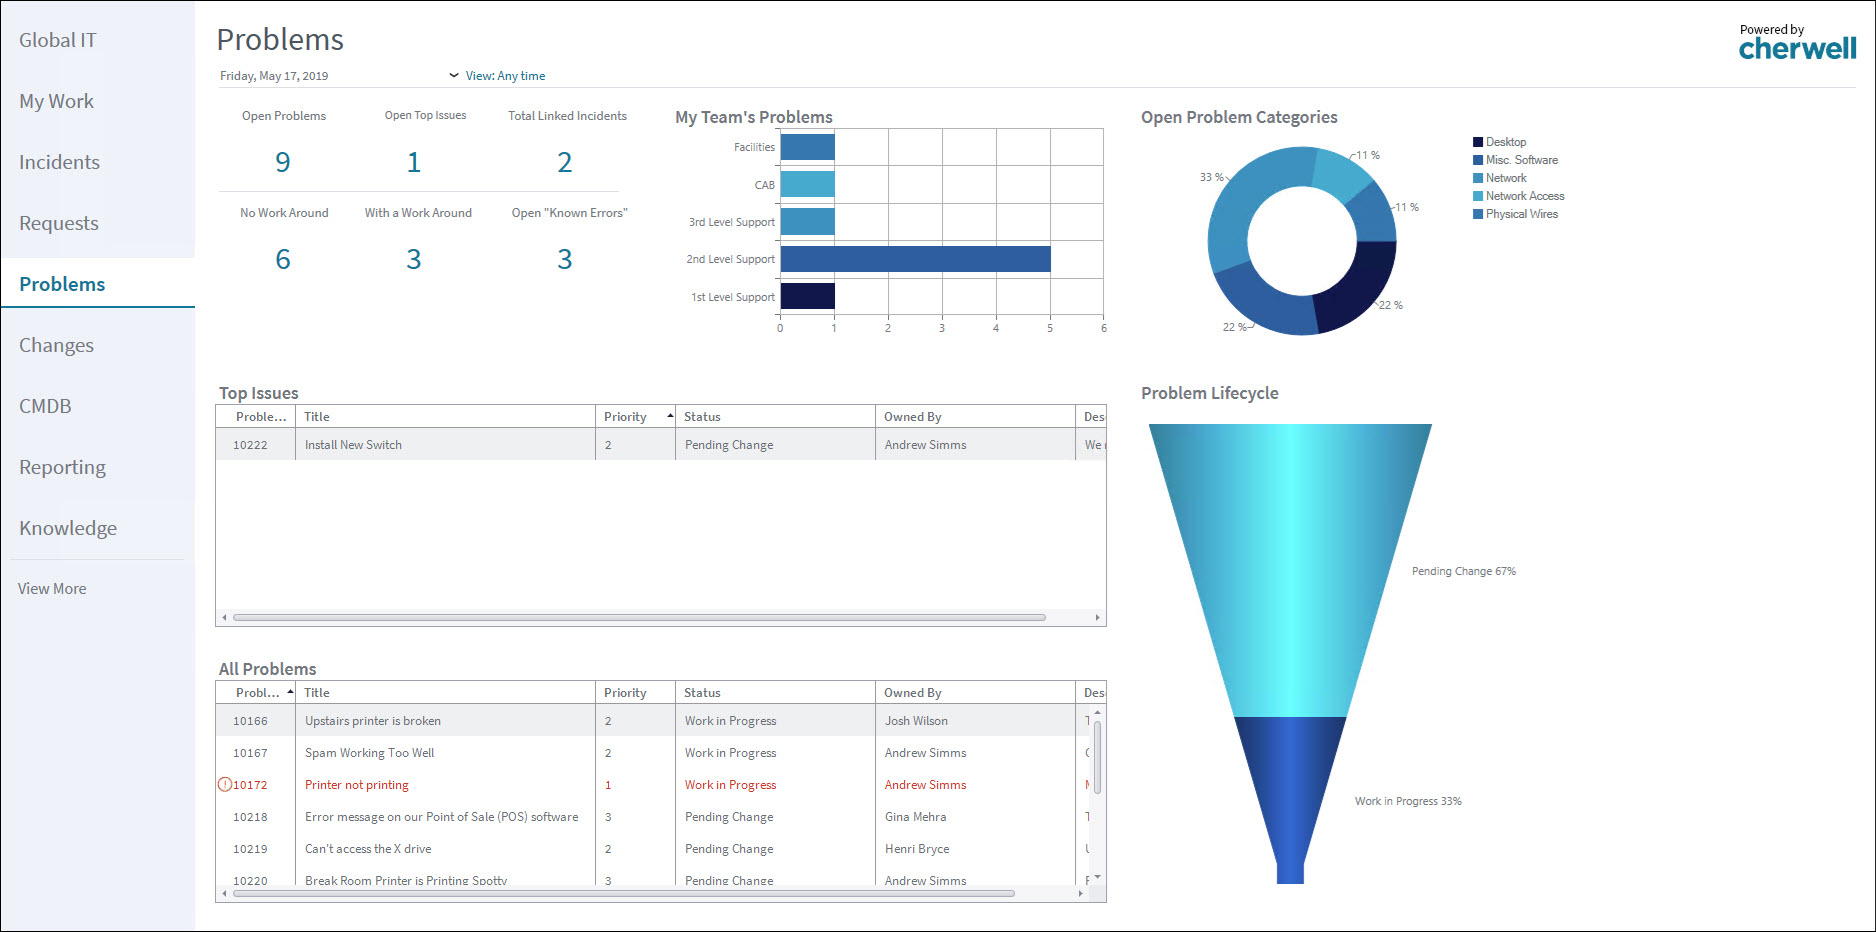
Problem Dashboard
CSM provides an OOTB Problem Dashboard that intuitively organizes your critical Problem metrics into a single control panel. The Dashboard displays the number of open Problems, number of open Top Issues (in the Portal), number of linked Incidents, number of Problems with and without workarounds, number of open known errors, number of Problems owned by Teams, percentage of Problems in each phase (New, Investigate, etc.), percentage of Problems in each category (based on Service), list of all Top Issues, and a list of all Problems.
Note: Problem metrics are also available on other Dashboards,
including Executive, Global IT, and Change.
Table: OOTB Problem Dashboard Widgets
| Item | Description | Widget Type | Widget Name | Widget Uses: |
|---|---|---|---|---|
| Open Problems | Number of open Problems (Status does NOT = Resolved or Closed). | Text Gauge | Total Open Problems | Open Problems Saved Search |
| Open Top Issues | Number of open Problems (Status does NOT = Resolved or Closed) Top Issues in Portal = True. | Text Gauge | Top Issues Count | Problems Set as Top Issues Saved Search |
| Total Linked Incidents | Number of open Incidents (Status does NOT = Resolved or Closed) linked to the Problem. | Text Gauge | Incidents Affected Counter | Incidents Linked to Problem Saved Search |
| No Work Around | Number of open Problems (Status does NOT = Resolved or Closed) with a cleared Workaround Exists check box. | Text Gauge | Problems with No Work Around | No Workaround Saved Search |
| With a Work Around | Number of open Problems (Status does NOT = Resolved or Closed) with a marked Workaround Exists check box. | Text Gauge | Problems with a Workaround | Workaround Exists Saved Search |
| Known Errors | Number of open Problems (Status does NOT = Resolved or Closed) with completed Workaround and Resolution fields. | Text Gauge | Known Error | Open: Known Error Saved Search |
| My Team's Problems | Percentage of open Problems (Status does NOT = Resolved or Closed) based on Team ownership. | Bar Chart | Problems by Teams | Open Problems Saved Search with values based on Owned By Team field. |
| Problem Lifecycle | Percentage of open Problems (Status does NOT = Resolved or Closed) based on the Status field. | Pipeline Chart | Problem Lifecycle | Pipeline slices represent Problem statuses. |
| Open Problem Categories | Percentage of open Problems (Status does NOT = Resolved or Closed) based on the Category field. | Pie Chart | Open Problems | Chart slices represent Problem categories. |
| Top Issues | List of Problems that have been identified as "Top Issues in Portal". | Search Results List | Global Issues | All Top Issues Saved Search. |
| All Problems | List of all open Problems (Status does NOT = Resolved or Closed). | Search Results List | All Problems | Open Problems Saved Search. |