Chart Shown on Group - Limit to Group Data Script
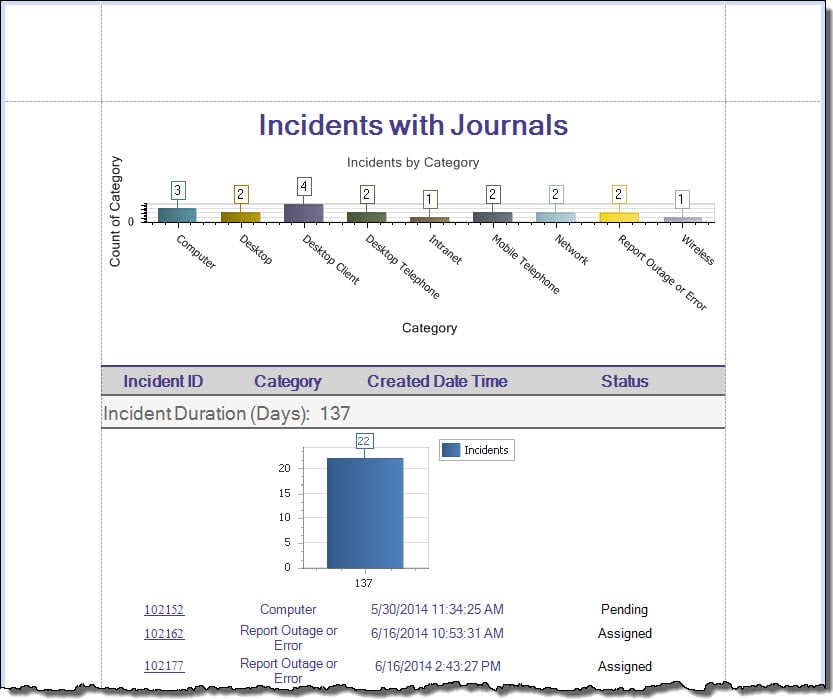
The Chart Shown on Group - Limit to Group Data script can be used to restrict the data displayed in a chart on a Group Header or Footer to that of the Group instead of using data from the entire Report.
Good to know:
- This script is only available for charts located in the Group Header or Footer bands of the Report. Reports without a chart in the Group Header or Footer bands do not have this script as an option in the Script Wizard.
- If there is only one Group Header or Footer, the band is automatically selected in the Script Wizard.
- If there is only one chart in the Group Header or Footer, the chart is automatically selected in the Script Wizard.
- Added scripts can be viewed in the Scripts tab.
To add a script to a Report using the Script Wizard:
- Open a Report in the Report Designer.
- In the Action toolbar, click the
Scripts button.
The Script Wizard opens.
- Select the
script, and then click
Next.
The Chart Show on Group properties window opens.
- Define the following properties:
- Band: The band of the Report housing the chart (example: IncidentDurationInDaysRounded_Group_Header is the Group Header containing the chart).
- Chart: The chart the script runs on (example: chart2 being the only chart available in the Group Header band).
-
Select Finish.
A notification window opens informing the User that the script has been added.