Working with Charts in Reports
You can use the Report Designer to customize properties for the chart’s legend, argument axis (x-axis), value axis (y-axis), data series, series labels, and diagram area at any time in the Report Designer. You can also run the Chart Wizard, which allows for complex customization of data and appearance.
Unlike the Report Wizard, the Chart Wizard can be used to modify an existing chart.
Charts provide many options for displaying data in reports. For more
information about using charts with the DevExpress® XtraReports
Designer, refer to:
- The DevExpress® Documentation (free).
- The Creating Reports for Summary Analysis course available in the Cherwell Video Learning Library (subscription-based).
Modifying Charts in the Report Designer
To modify an existing chart:
- In the Report Manager, right-click a Report, and then select Design Report.
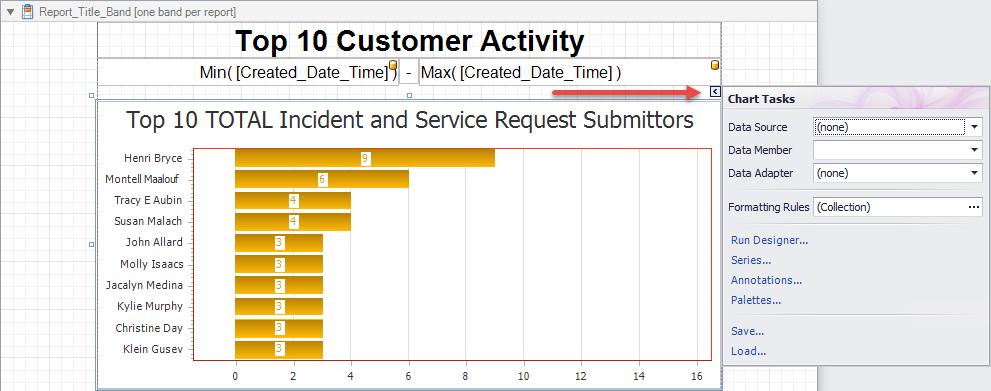
- To update multiple elements, run the Chart Wizard. Select the
chart, select the smart tag
 , and then select
Run Designer from the
Chart Tasks page.
, and then select
Run Designer from the
Chart Tasks page.
- To update individual components, select the chart, and then use the Property Grids for each individual component (legend, axis, labels, diagram).
Adding a New Chart From the Report Designer
You can place charts in any band, but if you place a chart outside of the header or footer band, you must add a script to switch from one group of data to the next.
To add a new chart:
- In the Report Manager, right-click a Report, and then select Design Report.
- From the control toolbar, drag the Chart icon to the title or footer band.
- The Chart Wizard opens.
- Use the Chart Wizard to create a chart. For example:
- Select the type of chart to display (bar, line).
- Define chart data.
- Define chart styling.
- Add titles and legends.