Define a Legend for a Chart Widget
Use the Legend page (accessed from within the Chart Widget Properties window) to define how a legend looks and behaves on a Chart Widget. Properties include:
- Show Legend: Shows/hides a legend.
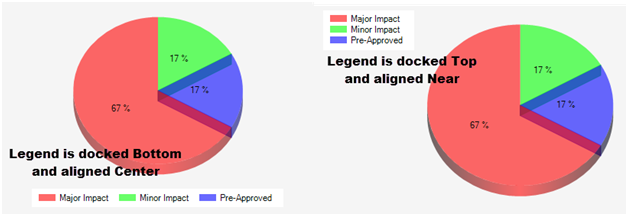
- Docking: Top, Left, Right, or Bottom, and aligned Near, Center, or Far.
- Alignment: Near, Center, or Far.
- Wrapping: Enable or disable wrapping of legend text.
- Constraint legend width: Set the maximum width of legend item text.
To define the legend for a Chart Widget:
- Create a Widget.
- In the Type drop-down, select Chart.
- Click the Legend page.
- Define properties:
- Show Legend:
Select this check box to display a legend on the chart. The legend identifies the series on the chart; the text is defined in the Series Name field (Series window).
- Docking:
Select a docking option for the legend:
- Top
- Left
- Right
- Bottom
- Alignment:
Select an alignment option for the legend:
- Near
- Center
- Far
- Show Legend:
- Wrap Legend Items:
Select this check box to wrap text for legend items to improve readability. Legend items are arranged in columns and ordered from top to bottom, then left to right.
Legend items are added to fill approximately half of the chart's width (left to right docking) or height (top or bottom docking). Remaining legend items can be viewed by clicking the ellipses at the bottom of the legend.
- Constrain Legend Width
Select this check box to control the width of legend text, and then specify the maximum legend item width in pixels.
Note: The Wrap Legend Items and Constrain Legend Width options do not apply to Pipeline charts. -
Select OK.