Define a Series for a Chart Widget
Use the Series page (in the Chart Widget Properties window) to define the data series to display on a Chart Widget. You can define one or multiple series:
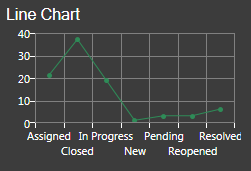
- Single Series: Allows you to track one data point (example: Number of
Incidents by status).
- Multiple series: Allows you to compare values so that you can detect
and forecast patterns. For example:
- Mean Time to Resolve Incidents (MTTR vs. Resolved/Closed Incidents).
- Mean Time To Resolve Incidents by Priority (P1 vs. P2 vs. P3, etc.).
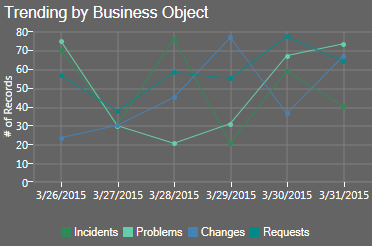
- Trending by Business Object (Number of Incidents, Problems,
Changes, and Requests).
 Note: The Chart Widget Properties window is accessed from within the Widget Manager when you create or edit a Chart Widget.
Good to know:
- You must have at least one series in a Chart Widget (CSM creates one by default).
- Doughnut, Pie, and Pipeline charts contain only one series.
- Bar, Column, Line or Scatter charts can contain multiple series, and can be combined in any way or number; however, you cannot mix field types. The x-axis can be only dates, or numbers, or text strings, not a combination.
- Bar and column series can be clustered (side-by-side) or stacked (series atop one another). For detailed information about stacking, see Stacked Bar Charts.
- The series has a preview with sample data; however, it is a preview of that data series only. The Widget preview shows all defined series.
- Data series names are listed in reverse order, with the first created
data series on top of all the others. Use the arrow buttons

 to change series order.
- To create a new series, click the
New button
 .
.
- To edit an existing series, click the
series, and then click the
Edit button
 . Each series can have its own individual set of
properties.
. Each series can have its own individual set of
properties.
To define a series for a Chart Widget:
- Create a Widget.
- In the Type drop-down, select Chart.
- Click the
Series page.
CSM automatically creates a series (you must have at least one).
- To create a new series, click the
New button
. To edit an existing series, click the series, and
then click the
Edit button
.
- Define general series properties:
- Name: Provide a display name to use in CSM. This is displayed on the legends and axes.
- Series Type: Select a
Chart
Type:
- Bar
- Column
- Doughnut
- Line
- Pie
- Pipeline
- Scatter
- Business Object: Select the
Business Object whose data you want to
include in the series.
Tip: Only one type of Business Object can be selected. The drop-down displays only Major Business Objects. To display all Business Objects, select the Show All check box.
- Show in Legend: Select this check box to display the name of the series in the Chart Widget legend.
- Combine Mode (Bar and Column series only): Select how to draw the
data series bars/columns (select one):
- Clustered: Draw bars/columns side-by-side on a common x or y-axis.
- Stacked: Stack data series atop one another on a shared x or y axis; the size of each data segment is proportional to its value (bars/columns will likely appear staggered or uneven).
- Stacked 100: Stack data series atop one another so that the data series total 100% of the bar/column (bars/columns will be the same height).
- Stack Group: Select the group key on which to stack the series (example: Stack series 1-2 on stack group 1, stack series 3-4 are on stack 2).
- Define options for the different Chart Types (series options vary by Chart Type):
-
Select OK.