Define a Value Bar Column for a Matrix Widget
Use the Columns page (in the Matrix Widget Properties window) to define how a value bar column looks and behaves on a Matrix Widget.
A value bar column displays a bar whose width represents a value. For example, display a value bar comparing the number of changes approved for each row.
Good to know:
- Calculated columns are calculated after all numeric columns have been retrieved.
- Calculated columns cannot query themselves.
To define a value bar column for a Matrix Widget:
- Create a Widget.
- In the Type drop-down, select Matrix.
- Click the Columns page.
- Click
Add>Calculated column.
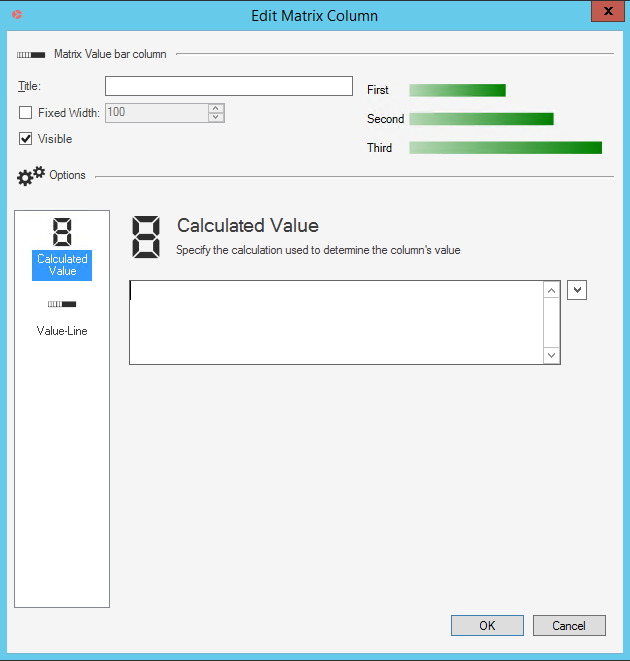
- Define how the value will be calculated:
- Click the Calculated Value page.
- Click the
Selector button
 , and then select the
Tokens (System Functions, Expressions,
Stored Values, Metrics, and/or Counters) and
math operators
to build the calculation.
, and then select the
Tokens (System Functions, Expressions,
Stored Values, Metrics, and/or Counters) and
math operators
to build the calculation.
- Define how the value bar looks:
- Click the
Value-Line page.
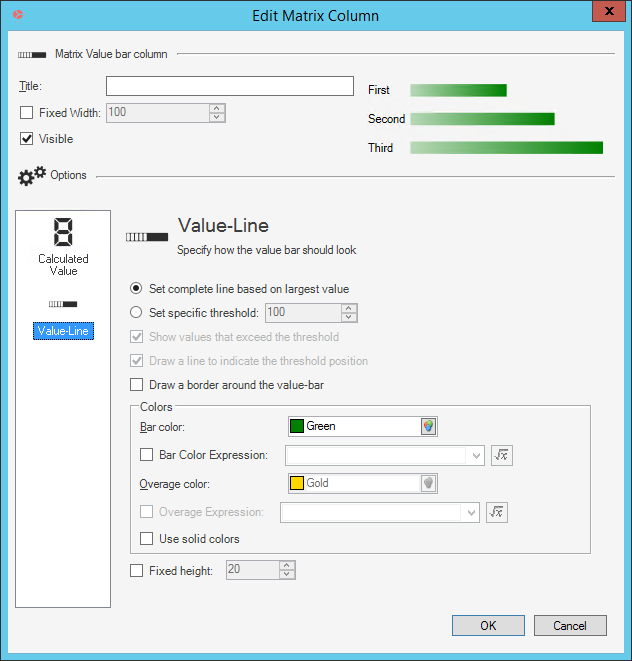
- Define the width of the value bar, either:
- Set Complete Line Based on Largest Value: Select this radio button to auto-determine the maximum width; the width of the value bars is based on the largest value of any row. For example, if the Hardware category has a value of 10, which is the largest, then the value bar for Hardware category will fill the entire width, and all other bars will be a percentage of that width.
- Set Specific Threshold: Select this radio button to specify a
maximum width. You can then select the following options:
- Show Values That Exceed the Threshold: Select this check box to show overages on the value bar (values that are greater than the specified threshold). Overages can be displayed in a different color (see Overage Color below). If not selected, value bars that exceed the maximum width appear cut off.
- Draw a Line to Indicate the Threshold Position: Select this check box to draw a short vertical line to indicate the specific threshold to make it easier to see.
- Draw a Border Around the Value Bar: Select this check box to draw a box around the whole value bar. If not selected, the value bar is free-floating.
- Define the colors of the value bar:
- Bar Color: Select the primary color for the value bar.
- Bar Color Expression: Select this check box to use an Expression to conditionally change the color of the value bar. Then, define the Expression.
- Overage Color: Select this check box to use a specific color for overages (bars that exceed the maximum width). Then, select a color.
- Overage Expression: Select this check box to use an Expression to conditionally change the color of the overage. Then, define the Expression.
- Use Solid Colors: Select this option to use a solid color on the value bar. By default, values bars are drawn using gradients, darkening towards the bar color as they get longer.
- Fixed Height: Select this check box to use a fixed height for the value bar. Then, specify the height. By default, the value bar takes up a calculated percentage of the available space for the row.
- Click the
Value-Line page.
-
Select OK.