Matrix Widgets
A Matrix Widget displays data from various Search Queries that are broken up into rows and columns. Use a Matrix Widget to show by fiscal year or quarter, the number of:
- Incidents
- Problems
- Changes.
Each row can be:
- A time period (example: A row for each month of the year).
- A particular value (example: Each supported category).
Each column can be:
- Determined by a Query (example: The number of Incidents closed in the specified month or for the specified category).
- Calculated based on other columns.
- A specialized display column for presenting data (a rating could show stars to represent a value, or a value bar could show how close to target a value approached).
Data can be pulled from multiple Business Objects and can be shown side-by-side.
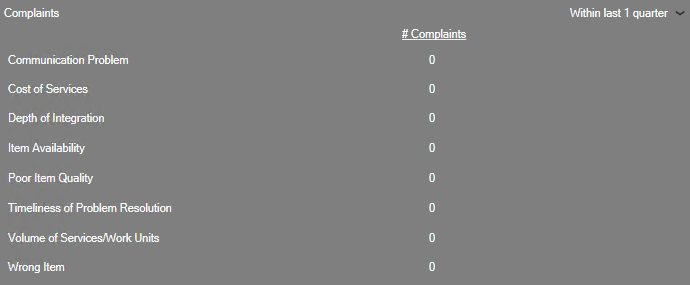
The following figure shows an example Matrix Widget.
Good to know:
- A Matrix Widget is highly configurable; define general properties (example: Title, associated Business Object, refresh rate, drill-down, and filter exclusions), rows, columns, and appearance.
- By default, a Matrix Widget acquires its text, color, border style, and background style properties from the defined Dashboard Theme; however, you can define your own properties, if needed.
-
Refresh executes only when a Widget is active and being displayed. If you leave a dashboard and come back to it, the data will be automatically refreshed and the refresh timer will start over.
- Use refresh on Widgets where the data is likely to change (example: A Widget displaying Incident data).
- A Dashboard's Refresh properties determine whether or not to 1) use the Dashboard's scheduled refresh instead, and/or 2) allow its Widgets to refresh themselves in addition to the Dashboard's scheduled refresh. For more information, refer to Dashboard Refresh in the Dashboards documentation.