Insights
The Exposure Insights dashboard offers an executive summary of your organization's security posture by illustrating the connections between your managed Assets and identified Exposures. Featuring comprehensive data visualizations—including asset distribution by exposure status and risk scores, as well as an overview of vulnerabilities, ransomware exposures, and patch availability —it enables users to quickly assess and understand exposure risks. Interactive components like Sankey charts and drill-down capabilities provide clear, actionable views of asset relationships and detailed exposure information, empowering periodic review and effective risk mitigation decisions.
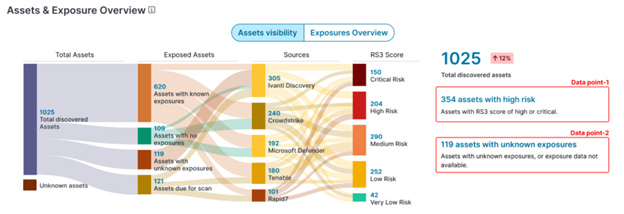
Assets and Exposure Overview chart
In the Exposure Insights dashboard, Sankey diagrams show how discovered assets flow through exposure states, sources, and RS³ risk scores. The dashboard offers two modes: Assets Visibility and Exposures Overview. Both use the same layout and adjust the context based on the selected filters. The Assets and Exposure Overview chart is the central component, summarizing all discovered assets and their associated risk levels.
You can access these views if you have an administrator or analyst role, or any custom role with default access permissions for Assets and Exposures in Global Settings. The interactive diagrams help you understand your organization’s security posture, identify gaps, prioritize risks, and track remediation progress over time.
Why Sankey Diagrams Are Used
Sankey diagrams are used to visualize the flow and distribution of assets and exposures across multiple categories. This type of diagram is especially effective for illustrating how data moves from one state to another and for highlighting concentrations or gaps in your security coverage.
Sankey diagrams help you to:
-
See relationships at a glance: Understand how assets and exposures are distributed across different categories, such as exposure status, scan coverage, and risk levels.
-
Identify security gaps: Quickly locate assets without exposure coverage, assets with outdated scans, or exposures that have not been remediated.
-
Assess risk concentration: Visualize where the highest risk exposures exist, allowing you to prioritize remediation efforts.
-
Communicate status clearly: Use clear visuals to share current status and progress with both technical and non-technical stakeholders.
Common Components of the Diagrams
-
Asset Distribution: Shows the number of assets in categories such as “scanned,” “unscanned,” “exposed,” or “not exposed.”
-
Exposure Trends: Highlights vulnerabilities based on severity, patch availability, and risk.
-
Source Attribution: Displays how assets or exposures are identified, providing insight into tool coverage and
Assets Visibility
Displays how discovered assets move from ingestion sources through to their designated risk levels. The diagram visualizes your data architecture across four progressive stages from left to right. The diagram is organized into several columns:
-
Total Assets: Shows the total number of assets discovered in your environment.
-
Total discovered assets: The consolidated count of all unique hardware and software targets identified across your corporate network.
-
Unknown assets: Discovered assets whose identity, ownership, or inventory status has not yet been confirmed.
-
-
Exposed Assets: Categorizes assets by their exposure status (known exposures, no exposures, unknown exposures, due for scan).
-
Assets with exposures: Managed assets that contain at least one identified, unmitigated security vulnerability or risk factor.
-
Assets with no exposures: Scanned assets that currently return zero known vulnerabilities.
-
Assets with unknown exposures: Discovered inventory that has not yet undergone a successful evaluation or validation process.
-
Assets due for scan: A subset of infrastructure requiring immediate scanning due to expired or missing exposure data.
-
-
Sources: This column breaks down asset count distribution by the connected discovery tools and security connectors running in your environment. Indicates which scanner or tool provided exposure data (e.g., Ivanti Discovery, Crowdstrike).
-
RS³ Score: This column groups your infrastructure into standardized risk categories based on severity matrix indicators (Critical, High, Medium, Low, Very Low).
Interacting with the Diagram
The bands/flows connecting the columns show how assets move from total discovery through exposure identification, source, and risk rating.
-
Clicking a node displays related data points in the pane to the right of the Sankey diagram. Clicking a data point opens a flyout with additional details.
-
You can explore key data points, like assets with high risk or unknown exposures, by clicking on the highlighted boxes in the diagram.
-
Each data point provides further details to help you take action, such as prioritizing scanning or remediation.
Assets Visibility Key Metrics (Sidebar)
The right-hand sidebar provides an immediate snapshot of high-priority operational items:
-
Total number of assets discovered: The absolute volume of unique endpoints recognized across all combined connector environments. Clicking on the main asset total takes you to a filtered asset list where you can review more details or take further actions.
-
Assets with high risk: The total number of critical endpoints containing an RS³ high or critical risk profile that require immediate mitigation or patch prioritization. Clicking on this, a list of Assets with high risk is displayed. You also have an Export option to export the list and an option Go to Assets to route you to Assets view page.
-
Assets due for scan: The total number of targets operating without recent or active exposure data. Clicking on this, a list of Assets due for scan is displayed. You also have an Export option to export the list and an option Go to Assets to route you to Assets view page.
Exposures Overview
When you select the Exposures Overview tab, the flow diagram shifts focus from asset inventory to the lifecycle and risk profile of individual vulnerabilities across your network.
The data flows across four technical operational stages from left to right:
Total Exposures
The absolute count of all security vulnerabilities, misconfigurations, and software weaknesses detected across your active endpoints.
VRR Score (Vulnerability Risk Rating)
This column prioritizes your exposures using the Vulnerability Risk Rating (VRR) scoring system. It maps exposures by threat urgency:
-
Critical threat (VRR 9.0–10.0)
-
High threat (VRR 7.0–8.9)
-
Medium threat (VRR 4.0–6.9)
-
Low threat (VRR 0.1–3.9)
Patchable Exposures
This column separates exposures based on actionable remediation workflows:
-
Patchable exposures: Vulnerabilities that have a directly correlated software patch or update available for deployment.
-
Non-patchable exposures: Weaknesses or configuration issues that require configuration changes, registry updates, or alternative compensating controls to resolve.
Remediation Operations
This column aligns patchable exposures with your deployment readiness:
-
Automated remediation: Vulnerabilities that can be addressed using automated patch policies or scheduled operational schedules.
-
Manual intervention required: Complex or high-impact updates that require administrator review, approval, or specific maintenance windows.
Exposures Overview Key Metrics (Sidebar)
The right-hand sidebar highlights the overall security exposure status for quick triage:
-
Total Discovered Exposures: The total number of vulnerabilities found in the environment. Clicking on the main total discovered exposures takes you to a filtered asset list where you can review more details or take further actions.
-
Exposures with Known Exploits: Vulnerabilities that attackers can easily use because exploit methods already exist. Clicking on this, a list of Exposures with Known Exploits is displayed. You also have an Export option to export the list and an option Go to Exposures to route you to Exposures view page.
-
Critical or High Exposures: The most serious vulnerabilities that can cause major impact if not fixed. You also have an Export option to export the list and an option Go to Exposures to route you to Exposures view page.
Overall Risk Score
The Organisation RS³ Insights Widget provides a high-level, single-metric view of your entire organization's cybersecurity risk profile. It enables CISOs, CIOs, and security administrators to continuously monitor the current security posture and quickly understand risk trends.
The widget aggregates individual Risk Scores for Security (RS³) from all devices and assets within your network into a single, cohesive organisational score.
Main risk gauge and grade
The main risk gauge displays your organization’s overall risk score at a glance.
-
Numerical scoreshows the aggregated RS³ score for your organization.
-
Grade (A–F) provides a letter grade that classifies your security posture.
-
A - 850 to 800
-
B - 799 to 700
-
C - 699 to 550
-
D - 549 to 400
-
F - =<399
-
-
Risk level displays a text label (for example, Medium risk) based on the score.
-
Last calculated shows the date and time when the score was last updated.
Below the gauge, a color-coded legend defines the grade and risk level thresholds. To the right of the gauge, the widget displays the security score trend over the last 7 days. For information on the root causes of the aggregated risk score, click on the link View score details at the bottom-left of the widget.
Data Calculation and Refresh
The RS³ widget uses the latest available data to calculate and display your organization’s risk score.
-
Aggregation method: combines RS³ scores from all scanned assets in your organization into a single, weighted score (similar to risk-based vulnerability management).
-
Current data: uses the latest available data for each asset when calculating the score.
-
Refresh frequency: updates the underlying data and calculations at least once every 24 hours.
-
Trend data: shows a 7-day trend based on daily snapshots of the organization’s RS³ score.
Open exposures by age and severity
This widget helps you visualize your exposure status over time. The severity axis levels are based on the Common Vulnerability Scoring System score and the age of the exposure.
Top 5 vulnerabilities
This widget shows you the top five CVEs based on the VRR score and the number of assets affected.
VRR is based on vulnerability intelligence from over 100 sources, including how likely a CVE will be exploited in the near future. This information is then used to calculate a consolidated score.
Ivanti Neurons for RBVM customers may be familiar with the VRR score used there. The main difference is that the VRR score used here includes exploitability prediction in the calculation.
Exposure Breakup
This funnel widget divides exposures by type, with the more critical and recommended actionable exposures to the left side of the widget. Each section is color-coded by severity and shows how many exposures are detected and the number of assets affected.
- Open Exposures: This stage provides a consolidated count of all exposures currently detected across your assets.
- Exploitable: These vulnerabilities are accompanied by publicly known exploits that can be leveraged by attackers, making them more dangerous and urgent to address.
- Ransomware: This stage includes vulnerabilities with known associations to ransomware families or those that have been exploited by ransomware gangs in the past. Remediation of exposures at this level is of utmost importance, as they pose a critical risk and could lead to debilitating ransomware attacks.
Each stage displays two columns:
Exposures: The total number of exposures identified at each severity level.
Assets: The number of affected assets.
Severity levels are color-coded—Critical (dark red), High (red), Medium (orange), and Low (yellow)—and are classified based on the VRR score:
-
Low: 0–4
-
Medium: >4–7
-
High: >7–9
-
Critical: >9
You can interact with the widget for deeper investigation. Clicking on asset counts within any severity or exposure stage redirects you to the Assets section with pre-applied filters, streamlining your workflow.
Asset discovery
The Assets Discovery widget provides a high-level view of how assets are distributed across asset types, helping you understand your inventory and validate counts against external systems such as a CMDB.
The widget displays a grouped bar chart, where it shows two bars for each asset type, one represents the total number of assets and the other represents the number of assets with identified exposures, allowing you to quickly compare inventory and exposure coverage.
To maintain readability, the widget displays the top seven asset types based on total asset count and groups all remaining and unknown asset types into an Others category. When you select a bar, the widget opens the Assets view and applies filters based on the selected asset type and exposure state, enabling you to quickly drill down into specific asset groups.
The widget helps you monitor asset distribution, identify exposure trends, and validate inventory data, and it provides a simple and consistent way to track asset coverage across your environment.
Asset vs Exposure timeline
The Asset vs Exposure timeline widget shows how asset coverage and exposure trends change over the last six calendar months. It helps you compare the number of assets with open exposures and understand how risk evolves over time. Assets include only those that have been scanned at least once.
Each month displays two side-by-side bars. The Assets bar shows the number of assets with at least one successful scan in that month. The Exposures bar shows the number of open exposure instances and uses a stacked format to display severity distribution. The widget groups exposures by Vulnerability Risk Rating (VRR) severity—Critical (deep red), High (red), Medium (orange), and Low (yellow).
What is RS³ Score
The RS³ score is a proprietary metric used to quantify the cybersecurity risk profile of an individual asset or an entire organization.
Score Range and Interpretation
The RS³ score—used for both Org RS³ (organizational risk) and Asset RS³ (individual asset risk)—ranges from 300 to 850. It functions similarly to a credit score:
-
300 - 399: Critical
-
400 - 549: High
-
550 - 699: Medium
-
700 - 799: Low
-
800 - 850: Very Low
Lower Scores (300-550): Indicate higher risk and a poor security posture (Red/Orange zones).
Higher Scores (700-850): Indicate lower risk and a strong security posture (Green/Blue zones).
Calculation Factors
The score is dynamically calculated based on four primary inputs:
-
Greatest VRR (Vulnerability Risk Rating): The score is driven by the largest VRR value among findings in each category (Critical, High, Medium, and Low). Critical vulnerabilities (9.0–10.0) reduce the RS³ score substantially.
-
Total Exposures: An asset with a higher number of open findings presents more risk and will result in a lower RS³ score.
-
Business Criticality Rating: Rated on a scale of 1 to 5. If a highly critical asset (e.g., a "5") has vulnerabilities, the RS³ score drops more aggressively because the potential business impact is higher.
-
Address Type: Whether the asset is Internal or External, which helps contextualize the exposure risk.
Purpose and Impact
-
Prioritization: It moves beyond static CVSS scores by factoring in real-world threat context and business importance.
-
Remediation: Closing many small findings may not move the score much; however, reducing the greatest VRR (the most severe vulnerability) on an asset will lead to a significant increase in the RS³ score.
-
Communication: Provides a standardized "health metric" that can be easily communicated to non-technical stakeholders to show the organization's risk level over time.