Audit Trails
Audit Trails offer a detailed log of user activities and system events to enhance visibility, accountability, and compliance. Audit Trails track important and specific actions for users and systems. They emphasize to log critical actions. It determines a pattern and identifies any unauthorized actions. These actions are then audited.
The components such as Power Management, Patch Management, and Patch Reports are supported for Audit Trails.
When multiple activities are performed on various patches, the table mentions as multiple patches and details are captured in additional details.
Viewing the Audit Trails
To view Audit Trails, navigate to Admin > Audit Trails.
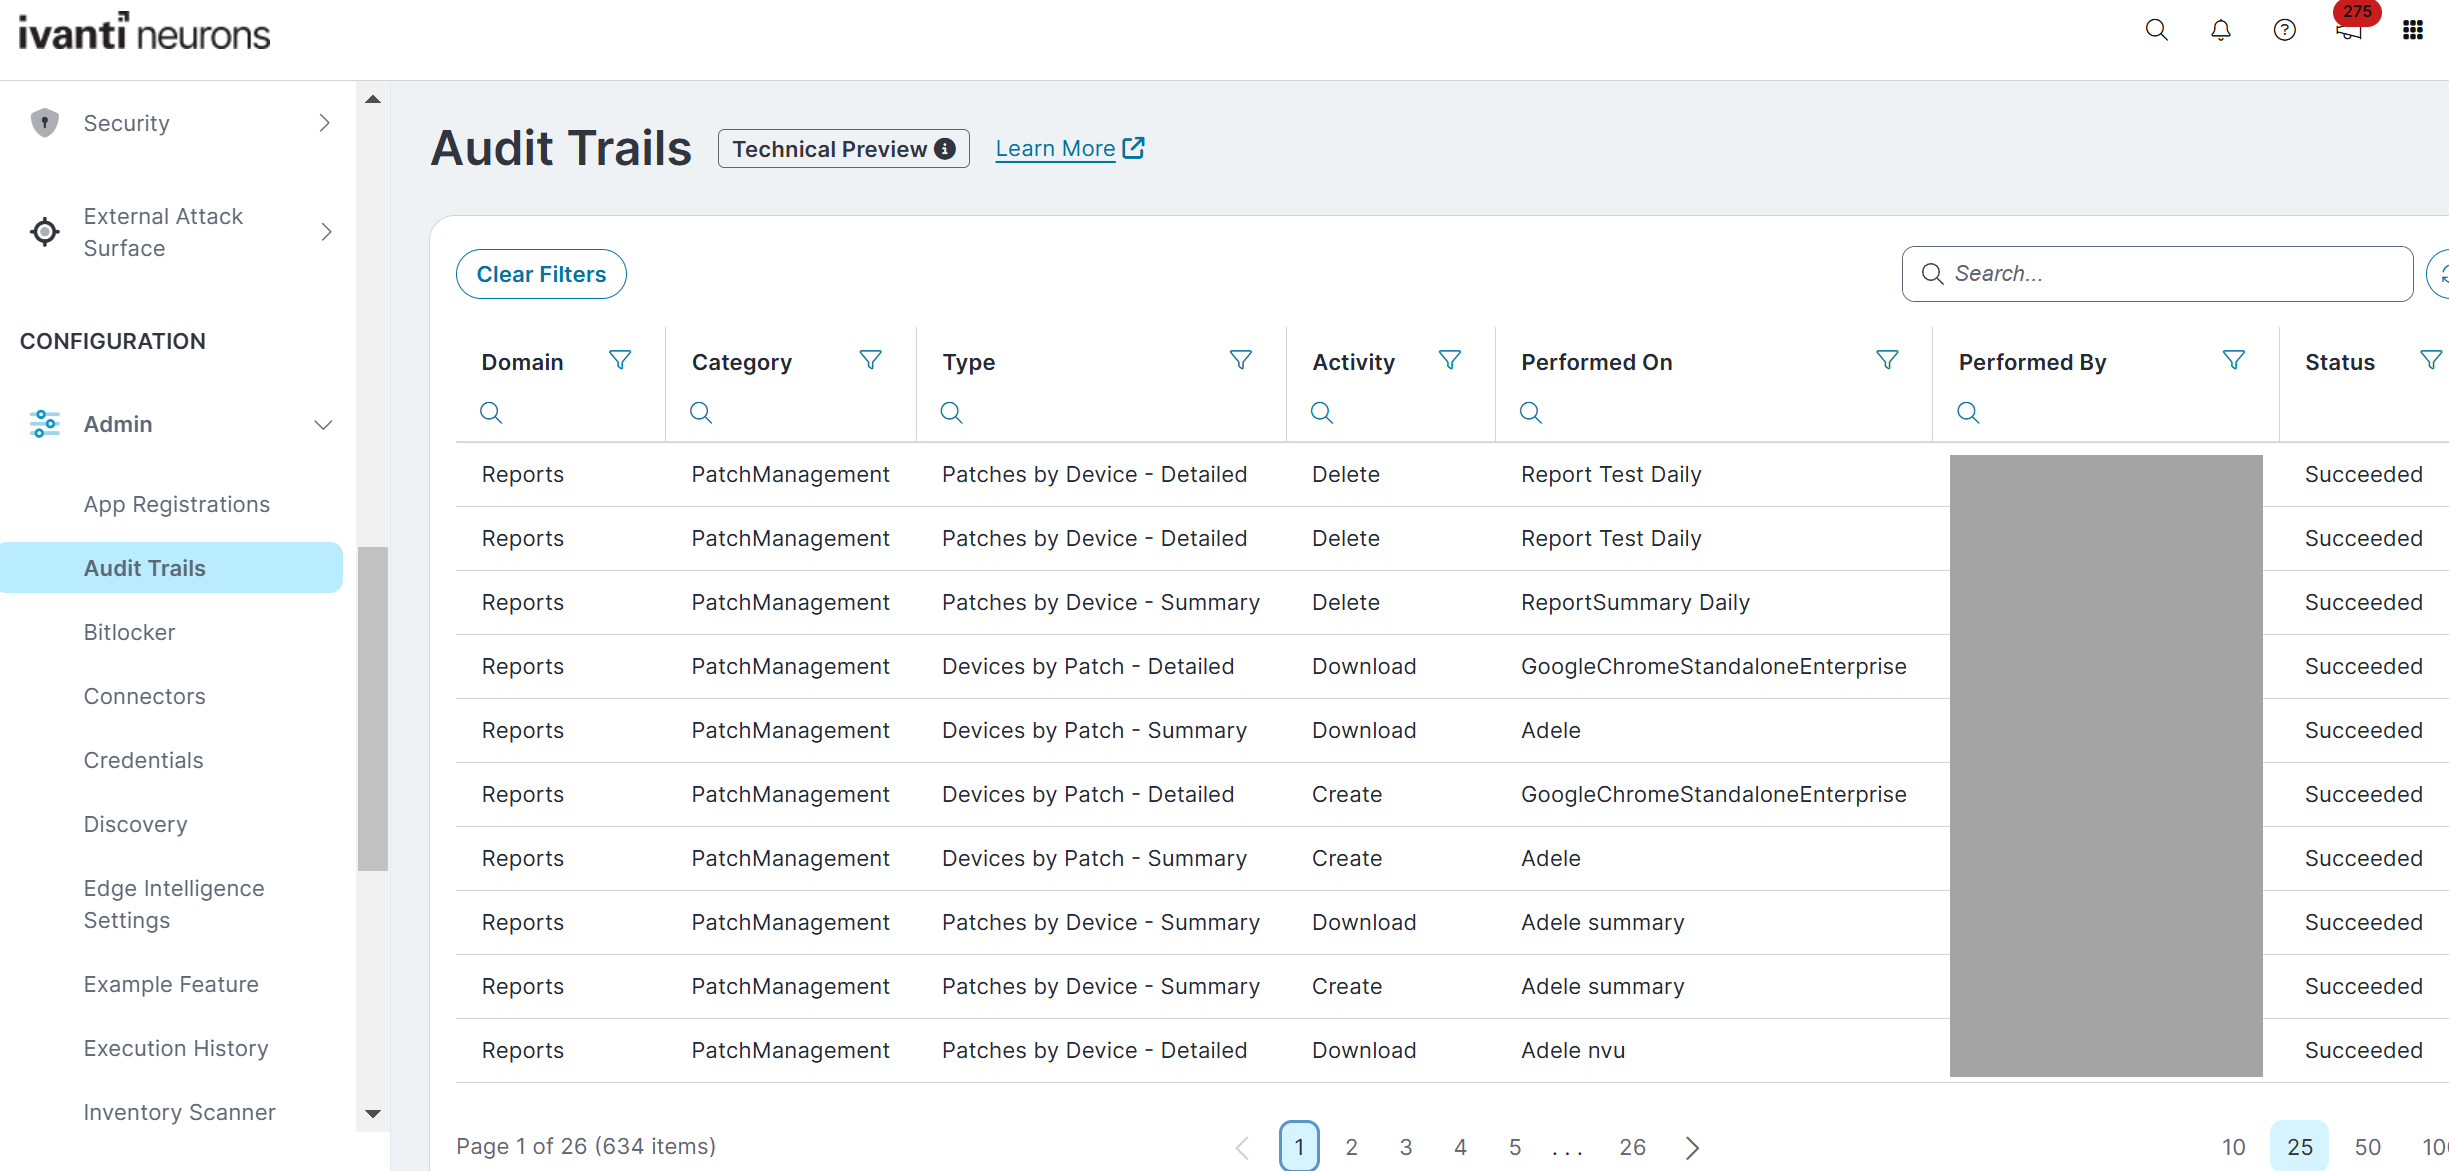
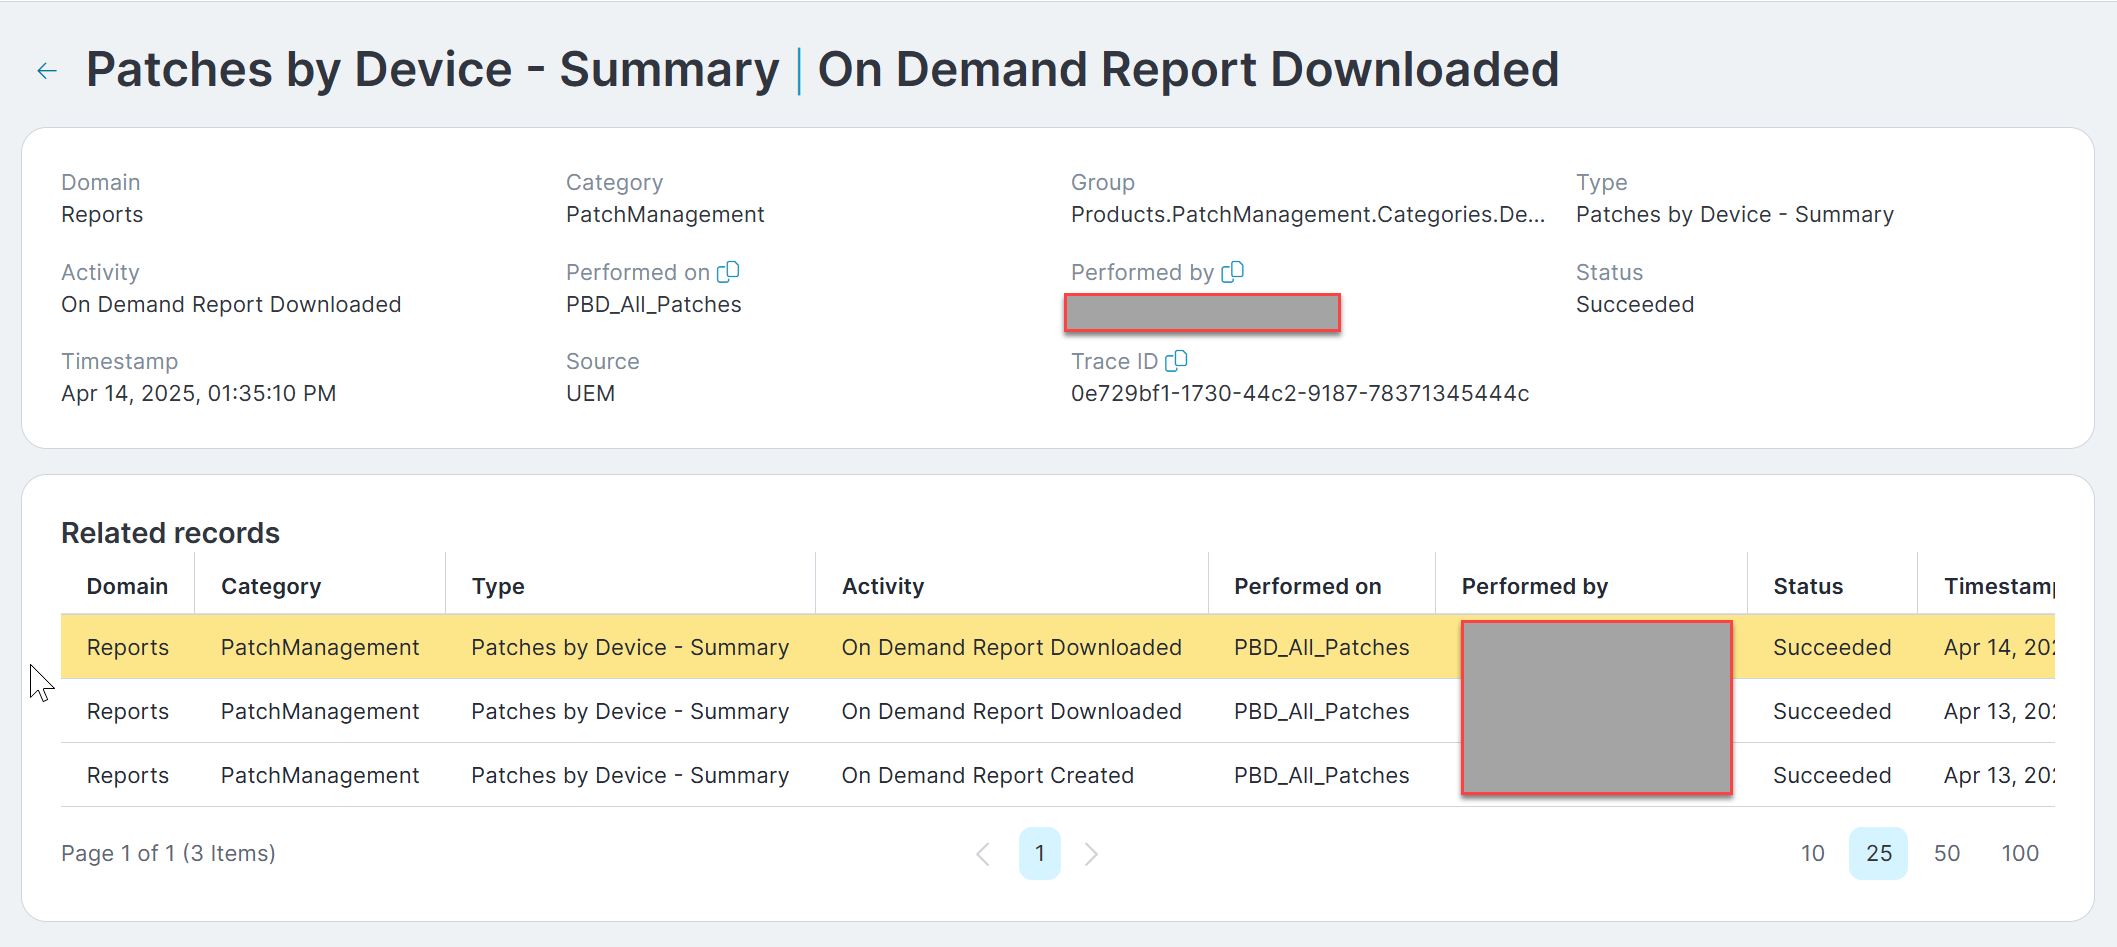
An event captured in the Audit Trails, may or may not have related records with additional details, or it is possible that it has related events, value changes made to an attribute, and additional attributes.
To view the additional details, click ![]() .
.
To export the report, select All or Selected Records from the Export to CSV drop-down.
Audit Trails Access Methods
The Ivanti Neurons Platform offers several ways to get audit logs, recognizing the wide range and scale of your needs. Each option is designed for a specific situation:
-
Rapid Investigation
Use the Audit Trails for quick troubleshooting. It lets you search through 30 days of logs to diagnose issues and track down incidents as they occur.
-
Regulatory Compliance
Schedule automated reports that deliver up to 90 days of data directly to your email. This feature is perfect for record keeping, periodic audits, and long-term review.
-
Security Information and Event Management (SIEM) Integration
Leverage the Azure Blob Storage connector or the Splunk HEC connector or Amazon S3 connector to export logs to your cloud storage or ingest them into third-party SIEM tools. You configure the connector to send logs every 30, 45, or 60 minutes, making this the ideal way to automate long-term storage and integrate with your complete security monitoring stack.
Comparing Audit Trails Access Methods
The following table gives you the details comparison of different ways of accessing Audit trails in Ivanti Neurons Platform:
Feature/Method Data Retention Integration Best Use Case Audit Trails 30 days None Immediate troubleshooting, active monitoring. Audit Trails Report 90 days Manual download from email Compliance audits, periodic archiving, regular review. Azure Blob Storage Connector Continuously export logs every 30, 45, or 60 minutes SIEM via Azure Central storage, SIEM pipeline integration, log aggregation. Splunk HEC Connector Continuously export logs every 30, 45, or 60 minutes Splunk Enterprise Advanced analytics, central correlation, threat detection. Continuously export logs every 30, 45, or 60 minutes
Amazon S3
To further process logs stored in your S3 bucket, you can use Logstack or another similar ingestion tool to pull logs from S3 and ingest them into Elasticsearch. This enables seamless integration of your stored log data with your ELK stack for enhanced search and analysis.
Important Notes
-
Audit Trails are captured when you initiate a remote control session. Due to system design, connection status and complete session details may not appear. Audit records show initiation events, but may not include all connection outcomes.
-
Audit trail entries may not appear simultaneously in the UI, reports, or outbound connector exports because of differences in data processing and storage. Sometimes, you may see an entry in one location before it appears elsewhere. Typically, delayed entries are included in the next scheduled report or outbound connector run.
-
The Audit Trails UI and direct export display up to 10,000 records. If you need more records for a 30-day period, use Reports to export all entries or apply filters in the UI to narrow your results.