Types of Charts
When defining the properties for the chart-type Dashboard Parts, you have the option to also determine the visual type of chart to display. Below are examples of the various types of charts that are available under the drop-down menu for the View Mode chart property.
Each Chart can have a slightly different appearance based on the data being reported and the properties defined for the chart (see Chart Properties ).
|
Name |
Example |
|
Lines |
|
|
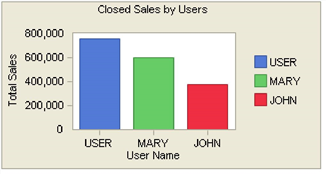
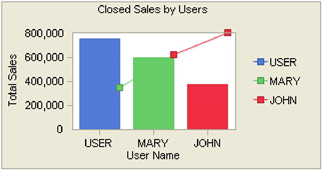
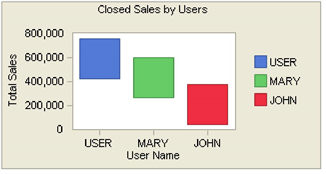
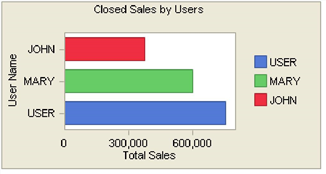
Bar |
|
|
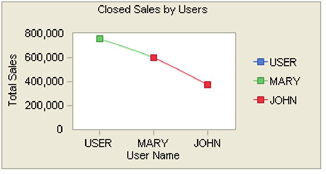
Curve |
|
|
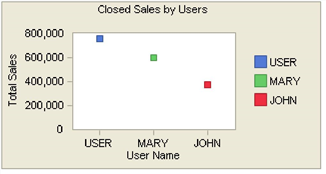
Scatter |
|
|
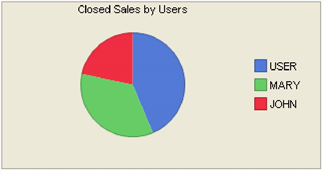
Pie |
|
|
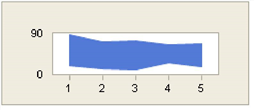
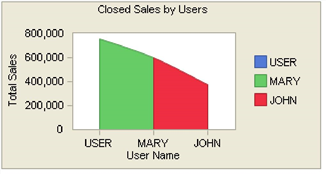
Area |
|
|
Pareto |
|
|
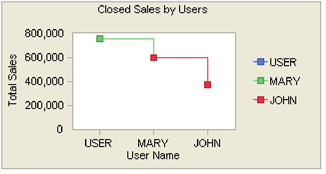
Step |
|
|
Surface |
|
|
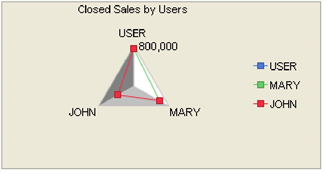
Radar |
|
|
Cube |
|
|
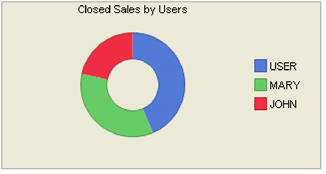
Doughnut |
|
|
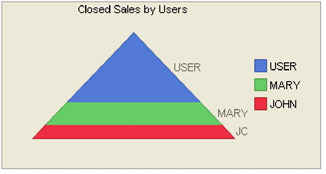
Pyramid |
|
|
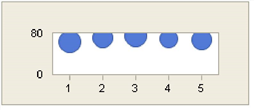
Bubble |
|
|
Contour |
|
|
CurveArea |
|
|
Gantt |
|
|
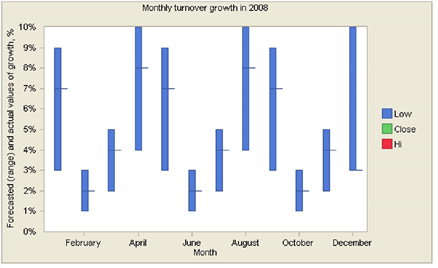
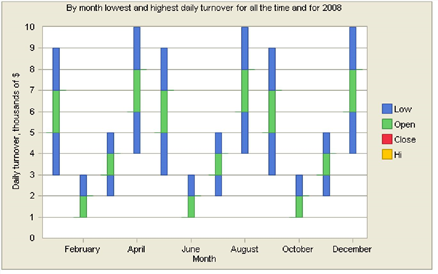
HiLowClose |
|
|
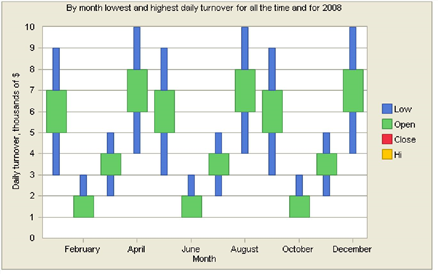
OpenHiLowClose |
|
|
Candlestick |
|