Working with Application Control Log Queries
You can create an application control log query to record the applications run or blocked on groups or individual endpoints, or on the network as a whole.
Creating an Application Control Log Query
You can create an application control log query to record details of blocked and authorized applications. A query can run immediately, or be scheduled for later or recurring execution.
- Select Review > Application Control Log Queries.
The Application Control Log Queries page is displayed. - Click Create.
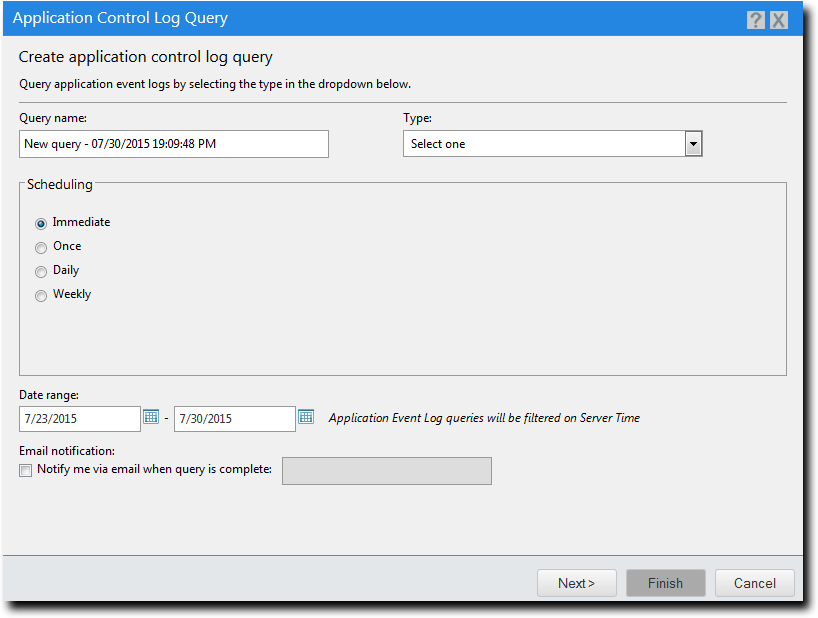
The Application Control Log Query Wizard is displayed.
- Type a name for the new query in the Query name field.
- Select the query Type.
- Select from the Scheduling options.
- Enter a start date, or click the calendar icon to select a date from the calendar.
- Enter a start time, or click the clock icon to select a time from the time view popup. Times are assigned at half-hour intervals.
- Enter a start date, or click the calendar icon to select a date from the calendar.
- Enter a start time, or click the clock icon to select a time from the time view popup. Times are assigned at half-hour intervals.
- Enter the interval in days at which the query will run. Default is 1 (every day).
- Enter a start date, or click the calendar icon to select a date from the calendar.
- Enter a start time, or click the clock icon to select a time from the time view popup. Times are assigned at half-hour intervals.
- Enter the interval in weeks at which the query will run. Default is 1 (every week).
- Select one or more days on which the query will run. At least one day must be selected.
- Specify the query's start date and end date in the Date Range fields.
-
Select whether you want an email notification when the query is complete. If you select this option, type your email address in the field provided.
- Click Next.
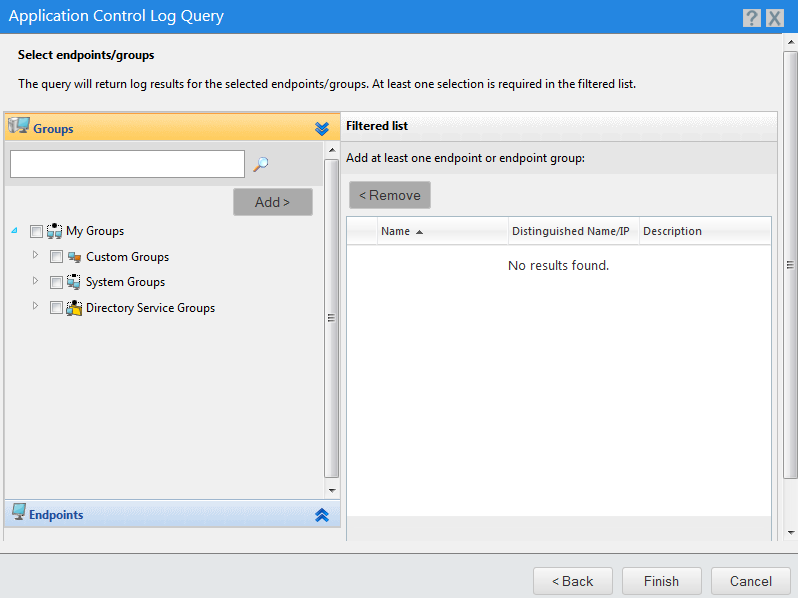
The Select endpoints/groups page is displayed.
- Build a list of targets (groups or endpoints) for the query, using any of the following methods:
- Select a group or groups from the Groups list.
- Click Add >.
- Select an endpoint or endpoints from the Endpoints list.
- Click Add >.
- Select a group or groups from the Assigned list.
- Click < Remove.
- Select an endpoint or endpoints from the Assigned list.
- Click < Remove.
- Click Finish.
The wizard closes and you return to the Application Control Log Queries page.
Give the query a descriptive name. For example, if this query relates to blocked applications on laptops in the sales group during July you could name it Blocked Applications - Sales Laptops - July.
|
Query Type |
Description |
|---|---|
|
All Application Events |
Lists all logged application control events for a given set of endpoints and/or groups. |
|
All Applications Added by Trusted Updaters |
Lists applications that are added to the whitelist and can execute as a result of a Trusted Updater policy. |
|
All Applications Allowed by Supplemental Easy Lockdown/Auditor Policy |
Lists applications that are added to the whitelist and can execute as a result of a Supplemental Easy Lockdown/Auditor policy. |
|
All Applications Allowed by Trusted Paths |
Lists applications that are allowed to execute as a result of a Trusted Path policy. |
|
All Applications Allowed by Trusted Publishers |
Lists applications that are allowed to execute as a result of a Trusted Publisher policy. Only local applications can be authorized by a Trusted Publisher policy, not applications that reside on a network share. |
|
All Applications Executed by Local Authorization |
Lists applications that are authorized or denied by a Local Authorization policy. The list includes applications that are denied because they timed out waiting for user input. |
|
All Denied Application Events |
Lists applications that are being blocked because they were not present on an endpoint before lockdown nor are they authorized by any trust mechanism. The list includes applications that are explicitly being blocked due to Denied Applications policy. |
|
All Memory Injection Detection Events |
Lists all file processes that were detected as being affected by reflective memory injection. As well as the file processes that were stopped, the list includes the processes that were not stopped because they were in audit mode or on an exclusion list. |
|
All Updaters Added by Trusted Updaters |
Lists updater applications that are added to an endpoint's Trusted Updater policy as a result of a trusted updater action. Trusted Updater policies on the server may need to be updated with these latest files. |
|
Easy Auditor: Applications Blocked when Enforcement is Enabled |
Lists applications that are not on the whitelist or authorized by a trust mechanism. These applications will be blocked as soon as enforcement is enabled (using Easy Lockdown). |
|
Most Frequently Denied Applications |
Lists in rank order the applications that are being blocked in your environment. These denials are because an application is not present on an endpoint before lockdown nor is it authorized by any trust mechanism. The list also includes applications that are explicitly being blocked due to a Denied Applications policy. |
|
Option |
Steps |
|---|---|
|
Immediate |
Run an on-demand query. The query runs when you click Finish. |
|
Once |
Schedule a once-off query: |
|
Daily |
Schedule a daily query: |
|
Weekly |
Schedule a weekly query: |
If the query results in no data found, then the subject line of the resulting email will contain the message Report result - No Results Found.
|
Method |
Steps |
|---|---|
|
To add groups of endpoints: |
|
|
To add individual endpoints: |
|
|
To remove groups of endpoints: |
|
|
To remove individual endpoints: |
|
Use the double-arrows (![]()
![]() ) to switch between groups and endpoints.
) to switch between groups and endpoints.
The selected groups and/or endpoints are displayed in the Assigned list.
A new application control log query is created. If it is a scheduled query, its summary is displayed under the Scheduled tab of the Application Event Logs page. When the query completes, its summary and a link to its results are displayed under the Completed tab of that page.
Viewing a Scheduled Application Control Log Query
You can view a list of scheduled application control log queries.
- Select Review > Application Control Log Queries.
- Click the Scheduled tab.
The Application Control Log Queries page displays a list of scheduled queries.
- Immediate
- Once
- Daily
- Weekly
- Scheduled - the query has not run before but is scheduled for a once-off or recurring execution.
- Running - the query is running.
- Finished - the query has run before and the last run was successful.
- Error - the query has run before and the last run was unsuccessful.
- If necessary, sort the list to find the query you want to view.
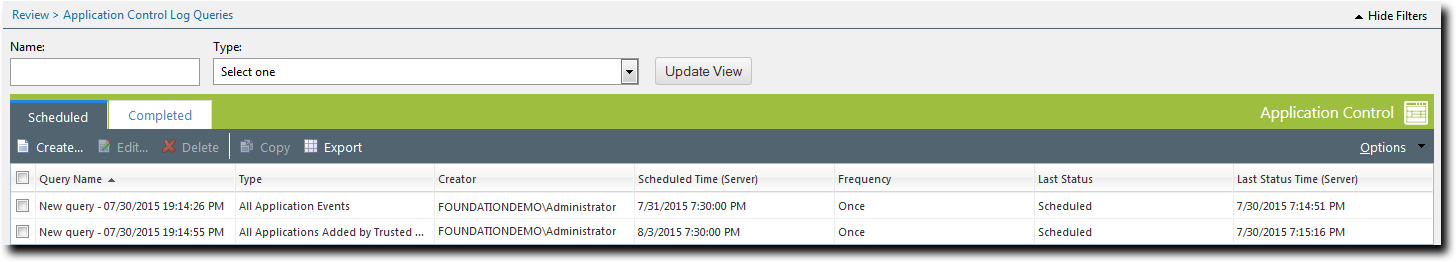
|
Column Name |
Description |
|---|---|
|
Query Name |
The name of the query. |
|
Type |
The type of query. |
|
Creator |
The user that created the query. |
|
Scheduled Time |
The last scheduled time for the query. |
|
Frequency |
|
|
Last Status |
|
|
Last Status Time |
The time of the last reported status. |
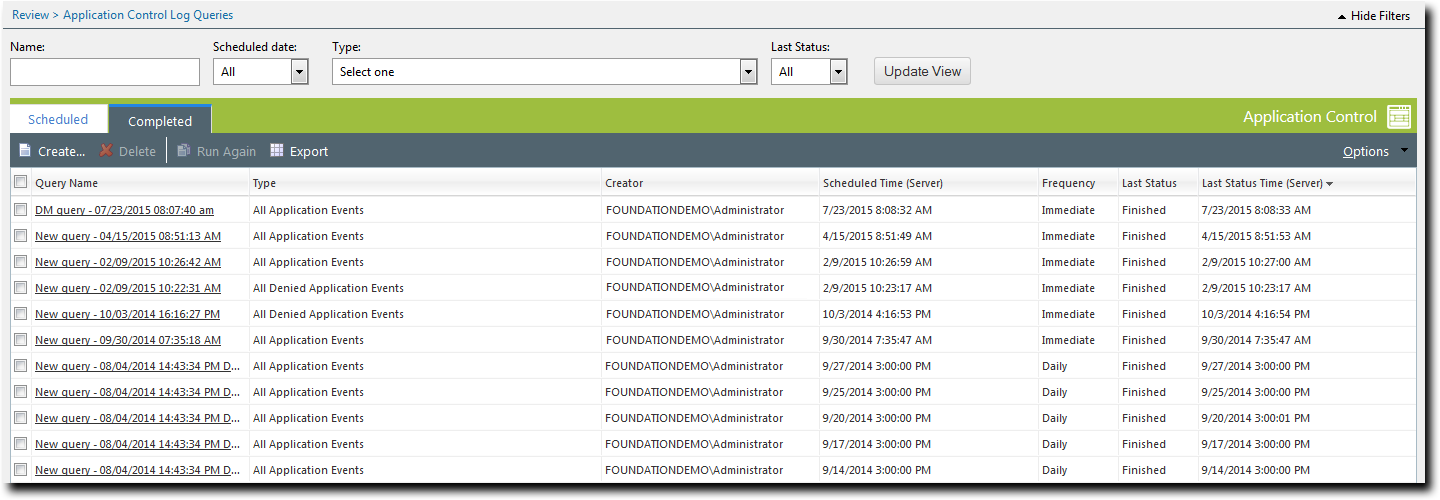
Viewing a Completed Application Control Log Query
You can view a list of completed application control log queries, and examine the details of each query.
- Select Review > Application Control Log Queries.
The Application Control Log Queries page opens displaying a list of completed queries.
- Immediate
- Once
- Daily
- Weekly
- Scheduled - the query has not run before but is scheduled for a once-off or recurring execution.
- Running - the query is running.
- Finished - the query has run before and the last run was successful.
- Error - the query has run before and the last run was unsuccessful.
- If necessary, sort the list to find the query you want to view.
- In the Query Name column, click the name of the query you want to view.
The Query Results page opens, displaying the detailed results of the query.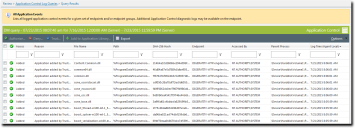
|
Column Name |
Description |
|---|---|
|
Query Name |
The name of the query. |
|
Type |
The type of query. |
|
Creator |
The user that created the query. |
|
Scheduled Time |
The last scheduled time for the query. |
|
Frequency |
|
|
Last Status |
|
|
Last Status Time |
The time of the last reported status. |
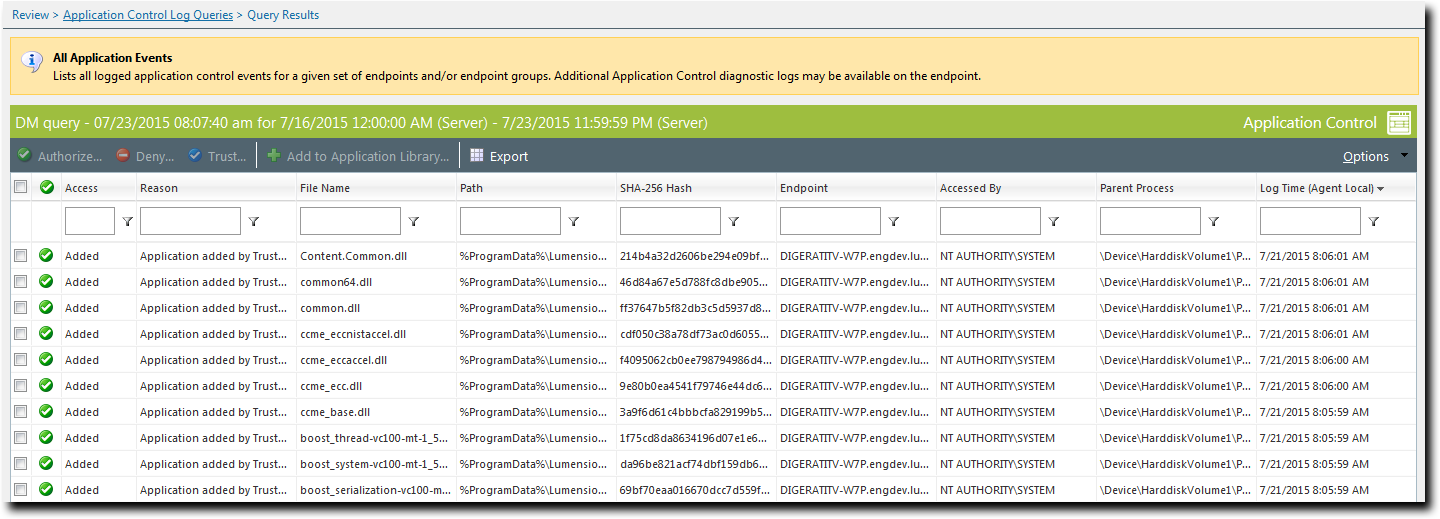
|
Column |
Description |
|---|---|
|
File Name |
The name of the file found during the query. |
|
Path |
The file path for the file. |
|
SHA-256 Hash |
The hash number for the file. |
|
Endpoint |
The endpoint that contains the file. |
|
Accessed By |
The user account used to access the file. |
|
Parent Process |
The parent process for the file. |
|
Log Time (Agent Local) |
The date and time the file was found during the query, by agent local time. |
|
Access |
The access status for the file - Added, Allowed, Denied, or Blocked. |
|
Reason |
The reason the file was added, allowed, denied or blocked. |
If diagnostic logging is switched on, an All Application Events query may contain diagnostic log entries, which are denoted by the Information icon/access value and contain "source-of-trust" (SOT) information. Some diagnostic log entries are linked to processes rather than applications, and some may not have SHA-256 Hash values as they are not directly linked to a file.
For more information, see Application Control Diagnostic Logging.
After Completing This Task:
Now you can refresh a completed application control log query as described below to update the results grid with relevant events sent to the server from endpoints since the query last ran.
Refreshing a Completed Application Control Log Query
You can refresh a completed Application Control Log Query to import the latest events into the results grid list without having to recreate the query.
- Select Review > Application Control Log Queries.
- The Application Control Log Queries page opens.
- [Optional] Sort the list to find the query you want to view.
- Click the name of the query you want to view in the Name column.
The Application Control Log Query Results page opens, displaying the detailed results of the query. - Click Refresh.
The results grid is updated with relevant events sent to the server from endpoints since the query last ran:
|
Scheduling |
Refresh Behavior |
|
|---|---|---|
| Immediate | Results are updated to reflect all events sent from endpoints in the last 24 hour period, from the moment Refresh is clicked. |
Original query is updated. |
| Once |
|
|
| Daily |
Duplicate query is created. |
|
|
Weekly |
Results are updated to reflect all events sent from endpoints in the past 7 days from 7*24 hours before to the present moment when Refresh is clicked. |
|
Application Control Diagnostic Logging
Diagnostic logging provides more information than standard logging, but is switched off by default because of the large amount of information it sends to the server.
Application Control diagnostic logging provides a more detailed level of information than standard logging. These log entries appear in All Application Events log queries and are denoted by the Information icon/access value.
The diagnostic logs can help a system administrator to diagnose Trusted Updater issues. For example, an administrator creating Trusted Updater policies may sometimes authorize more applications than intended. Analyzing the diagnostic logs and following the “source of trust” can identify the relevant policy and show how it should be modified to restrict trust to the desired applications.
Diagnostic logging increases the volume of log traffic being sent from the endpoints to the server, so it should only be used if the logs are needed for troubleshooting. To switch on diagnostic logging, please contact Ivanti Self Service Support (https://success.ivanti.com/customers/community_contactsupport).
Editing a Scheduled Application Control Log Query
You can edit a scheduled application control log query.
- Select Review > Application Control Log Queries.
- Click the Scheduled tab.
The Application Control Log Queries page displays a list of scheduled queries. - If necessary, sort the list to find the query you want to edit.
- Select the check box beside the query name.
- Click Edit.
The Application Control Log Query wizard opens, displaying details of the selected query. - [Optional] Change the name of the query in the Query name field.
- [Optional] Change the query Type.
- [Optional] Change the Scheduling option.
- Enter a start date, or click the calendar icon to select a date from the calendar.
- Enter a start time, or click the clock icon to select a time from the time view popup. Times are assigned at half-hour intervals.
- Enter a start date, or click the calendar icon to select a date from the calendar.
- Enter a start time, or click the clock icon to select a time from the time view popup. Times are assigned at half-hour intervals.
- Enter the interval in days at which the query will run. Default is 1 (every day).
- Enter a start date, or click the calendar icon to select a date from the calendar.
- Enter a start time, or click the clock icon to select a time from the time view popup. Times are assigned at half-hour intervals.
- Enter the interval in weeks at which the query will run. Default is 1 (every week).
- Select one or more days on which the query will run. At least one day must be selected.
- [Optional] Change the query's start date and end date in the Date Range fields.
- [Optional] Select whether you want an email notification when the query is complete. If you select this option, type your email address in the field provided.
- Click Next.
The Select endpoints/groups page is displayed
. - [Optional] Change the list of targets (groups or endpoints) for the query, using any of the following methods:
- Select a group or groups from the Groups list.
- Click Add >.
- Select an endpoint or endpoints from the Endpoints list.
- Click Add >.
- Select a group or groups from the Assigned list.
- Click < Remove.
- Select an endpoint or endpoints from the Assigned list.
- Click < Remove.
- Click Finish.
The wizard closes and you return to the Application Control Log Queries page.
|
Column Name |
Description |
|---|---|
|
Query Name |
The name of the query. |
|
Type |
The type of query. |
|
Creator |
The user that created the query. |
|
Scheduled Time |
The last scheduled time for the query. |
|
Frequency |
Immediate, Once, Daily, Weekly. |
|
Last Status |
Finished. |
|
Last Status Time |
The time of the last reported status. |
You can select only one query to edit at a time.
Keep at least part of the original query name so that you will know that this query has been modified.
|
Query Type |
Description |
|---|---|
|
All Application Events |
Lists all logged application control events for a given set of endpoints and/or groups. |
|
All Applications Added by Trusted Updaters |
Lists applications that are added to the whitelist and can execute as a result of a Trusted Updater policy. |
|
All Applications Allowed by Supplemental Easy Lockdown/Auditor Policy |
Lists applications that are added to the whitelist and can execute as a result of a Supplemental Easy Lockdown/Auditor policy. |
|
All Applications Allowed by Trusted Paths |
Lists applications that are allowed to execute as a result of a Trusted Path policy. |
|
All Applications Allowed by Trusted Publishers |
Lists applications that are allowed to execute as a result of a Trusted Publisher policy. Only local applications can be authorized by a Trusted Publisher policy, not applications that reside on a network share. |
|
All Applications Executed by Local Authorization |
Lists applications that are authorized or denied by a Local Authorization policy. The list includes applications that are denied because they timed out waiting for user input. |
|
All Denied Application Events |
Lists applications that are being blocked because they were not present on an endpoint before lockdown nor are they authorized by any trust mechanism. The list includes applications that are explicitly being blocked due to Denied Applications policy. |
|
All Memory Injection Detection Events |
Lists all file processes that were detected as being affected by reflective memory injection. As well as the file processes that were stopped, the list includes the processes that were not stopped because they were in audit mode or on an exclusion list. |
|
All Updaters Added by Trusted Updaters |
Lists updater applications that are added to an endpoint's Trusted Updater policy as a result of a trusted updater action. Trusted Updater policies on the server may need to be updated with these latest files. |
|
Easy Auditor: Applications Blocked when Enforcement is Enabled |
Lists applications that are not on the whitelist or authorized by a trust mechanism. These applications will be blocked as soon as enforcement is enabled (using Easy Lockdown). |
|
Most Frequently Denied Applications |
Lists in rank order the applications that are being blocked in your environment. These denials are because an application is not present on an endpoint before lockdown nor is it authorized by any trust mechanism. The list also includes applications that are explicitly being blocked due to a Denied Applications policy. |
|
Option |
Steps |
|---|---|
|
Immediate |
Run an on-demand query. The query runs when you click Finish. |
|
Once |
Schedule a once-off query: |
|
Daily |
Schedule a daily query: |
|
Weekly |
Schedule a weekly query: |
If the query results in no data found, then the subject line of the resulting email will contain the message Report result - No Results Found.
|
Method |
Steps |
|---|---|
|
To add groups of endpoints: |
|
|
To add individual endpoints: |
|
|
To remove groups of endpoints: |
|
|
To remove individual endpoints: |
|
Use the double-arrows (![]()
![]() ) to switch between groups and endpoints.
) to switch between groups and endpoints.
The selected groups and/or endpoints are displayed in the Assigned list.
The application control log query has been edited.
Copying a Scheduled Ivanti Application Control Log Query
You can create and run a new Application Control Log Query based on a Scheduled query.
Prerequisites:
You must be assigned the Manage Application Control Event Logs access right.
- Select Review > Application Control Log Queries.
- Click the Scheduled tab.
A list of scheduled queries is displayed. - If necessary, sort the list to find the query you want to copy.
- Select the check box beside the query name. You can copy only one query at a time.
- Click Copy.
The Create application control log query wizard opens, displaying the details of the selected query. All the settings are the same as the original query, except "Copy of" is added to the Query name and the Start date is reset (for Scheduling of type Once, Daily, and Weekly). - Complete the wizard to modify the query settings as required.
If you need to indicate that this query is based on an exiting one, keep at least part of the original Query Name.
You have created a new Application Control Log Query based on a Scheduled query and executed it. If not run immediately, it will appear under the Scheduled tab on the Application Control Log Quries page.
Rerunning a Completed Application Control Log Query
You can create and run a new Application Control Log Query based on a Completed query.
Prerequisites:
You must be assigned the Manage Application Control Event Logs access right.
- Select Review > Application Control Log Queries.
- Click the Completed tab.
A list of completed queries is displayed. - If necessary, sort the list to find the query you want to rerun.
- Select the check box beside the query name. You can rerun only one query at a time.
- Click Run Again.
The Create application control log query wizard opens, displaying the details of the selected query. All the settings are the same as the original query, except "Copy of" is added to the Query name and the Start date is reset (for Scheduling of type Once, Daily, and Weekly). - Complete the wizard to modify the query settings as required.
If you need to indicate that this query is based on an exiting one, keep at least part of the original Query Name.
You have created a new Application Control Log Query based on a Completed query and executed it. If not run immediately, it will appear under the Scheduled tab on the Application Control Log Queries page.