The Home Page
The entry point to Ivanti Endpoint Security is the Home Page. From this page you can view the dashboard, which features drag-gable widgets that display information about Ivanti Endpoint Security and agent-managed endpoints.
Some widgets display general information about the system, others provide links to documentation, and still others summarize activity for Ivanti Endpoint Security modules you are licensed for.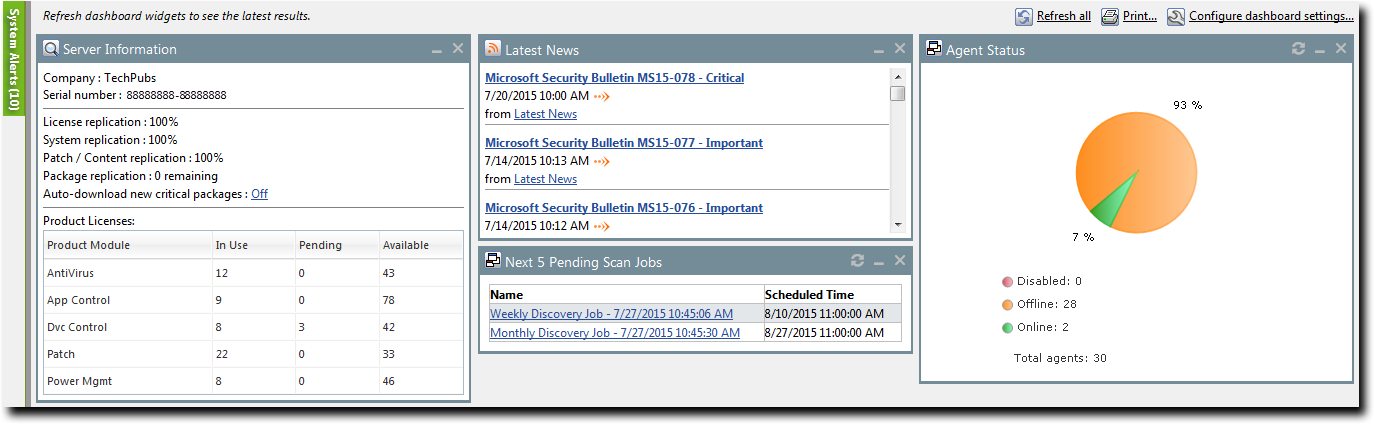
The Dashboard
The dashboard displays widgets depicting the activity on your protected network. Located on the Home page, the dashboard provides convenient information you can use to ensure your network protection is up to standard. Additionally, you can customize the dashboard to display the widgets most applicable to your network environment.
Widget graphs are generated based on the latest data and statistics available from endpoints, groups, module-specific data, and so on.
The following Dashboard widgets are available:
- The Agent Module Installation Status Widget
- The Agent Status Widget
- The Applicable Content Updates Widget
- The Discovery Scan Results: Agents Widget
- The Critical Patch Status by Endpoint Widget
- The Endpoints with Unresolved Updates Widget
- The Incomplete Deployments Widget
- The Last 5 Completed Scan Jobs Widget
- The Latest News Widget
- The Mobile Endpoint Last Check In Widget
- The Mobile Endpoint Status Widget
- The Mobile Endpoints with Policy Widget
- The Mandatory Baseline Compliance Widget
- The Next 5 Pending Scan Jobs Widget
- The Offline Patch Endpoints Widget
- The Patch Agent Module Status Widget
- The Scheduled Deployments Widget
- The Server Information Widget
- The Time Since Last DAU Scan Widget
- The Un-remediated Critical Vulnerabilities Widget
- The Endpoints with Unresolved AV Alerts Widget
- The Top 10 Infected Endpoints Widget
- The Top 10 Virus/Malware Threats Widget
- The Estimated Energy Savings: Daily Widget
- The Estimated Energy Savings: Weekly Widget
- The Estimated Energy Savings: Monthly Widget
- The Device Control Denied Actions Widget
- The Devices Connected to Endpoints Widget
The Agent Module Installation Status Widget
This widget displays the installation and licensing stats of each agent module.
A graph bar displays for each installed module. The following table describes the widget graph.
|
Bar Color |
Description |
|---|---|
|
Blue |
The number of endpoints with the module pending install or uninstall. |
|
Green |
The number of endpoints with the module installed. |
|
Red |
The number of endpoints without the module installed. |
Click the graph to open the Endpoints page.
Endpoints with an agent version that does not support a module are not counted.
The Agent Status Widget
This widget displays all agents grouped by agent status.
|
Field |
Description |
|---|---|
|
Online |
The number of agents that are online. |
|
Offline |
The number of agents that are offline. Offline status is determined by the amount of time since the agent last communicated as determined on the Options page. |
|
Disabled |
The number of agents that are disabled. |
|
Total Agents |
The total number of agents in your environment. |
|
Click the graph to open the Endpoints page. The page is filtered to display all agents. |
|
The Applicable Content Updates Widget
This widget displays applicable content updates grouped by content type. View this widget when determining what content is applicable to endpoints in your network.
Graph bars:
|
Bar |
Description |
|---|---|
|
Critical |
The number of critical content items that are applicable to the your endpoints. |
|
Recommended |
The number of recommended content items that are applicable to your endpoints. |
|
Optional |
The number of optional software, informational, and virus removal content items that are applicable to your endpoints. |
|
Click the widget graph to open the Content page, which is filtered to display all applicable non- patched content. |
|
Widget fields:
|
Field |
Description |
|---|---|
|
Applicable updates |
The total number of content items applicable to your endpoints. |
|
Endpoints |
The total number of endpoints with applicable updates. |
Note:
- Updates that are globally disabled (or marked Do Not Patch for all endpoints) are excluded from the widget bars and Applicable updates count.
- Updates that are marked Do Not Patch for at least one endpoint (but not all) are still included in the widget bars and Applicable updates count.
- If an endpoint is marked as Do Not Patch for an applicable update, that update is no longer considered applicable. Therefore, that endpoint is only included in the Endpoints count if it has other unresolved updates.
The Critical Patch Status by Endpoint Widget
This widget depicts the patch status of all managed endpoints. Each bar indicates the number of managed endpoints with applicable vulnerabilities within a given release date range.
The following table describes the Critical Patch Status By Endpoint widget. Green bars indicate endpoints that are patched for critical vulnerabilities, while red bars indicate endpoints that are not patched for critical vulnerabilities.
Critical Patch Status By Endpoint Bars:
|
Graph Bar |
Description |
|---|---|
|
<30 days |
The number of endpoints with applicable critical vulnerabilities fewer than 30 days old. |
|
30 - 120 days |
The number of endpoints with applicable critical vulnerabilities between 30 to 120 days old. |
|
>120 days |
The number of endpoints with applicable critical vulnerabilities greater than 120 days old. |
The following table describes the widget fields.
|
Field |
Description |
|---|---|
|
Endpoints |
The total number of endpoints with applicable critical vulnerabilities. |
|
Critical vulnerabilities |
The total number of critical vulnerabilities applicable to your environment. |
Click the graph to open the Critical Vulnerabilities content page.
Note:
- If an endpoint is marked as Do Not Patch for a critical vulnerability, that vulnerability is no longer considered applicable. Therefore, that endpoint is only included in the graph bars and the Endpoints count if it has other unresolved critical vulnerabilities.
- Vulnerabilities that are globally disabled (or marked Do Not Patch for all endpoints) are excluded from the Critical vulnerabilities count.
- Vulnerabilities that are marked Do Not Patch for at least one endpoint (but not all) are still included in the Critical vulnerabilities count.
The Discovery Scan Results: Agents Widget
This widget displays the number of endpoints capable of hosting agents discovered in the latest Discovery Scan Job. The endpoints are classified in to two groups: endpoints with agents and endpoints without agents.
|
Field |
Description |
|---|---|
|
As of |
The name of the Discovery Scan Job used to generate the widget graph and statistics. This job is the job most recently run. |
|
Endpoints with agents |
The number of agent-compatible endpoints discovered that have agents installed. |
|
Endpoints without agents |
The number of agent-compatible endpoints discovered that have no agents installed. |
|
Endpoints |
The total number of agent-compatible endpoints discovered. |
Click the widget to open the Results page for the most recently run Discovery Scan Job.
The Endpoints with Unresolved Updates Widget
This widget displays all endpoints with unapplied applicable content updates, grouped by content type. View this widget when determining if an endpoint requires deployment.
An unresolved update is an occurrence of an endpoint that has not had an applicable content item installed.
|
Bar |
Description |
|---|---|
|
Critical |
The number of endpoints that have unresolved critical content updates. |
|
Recommended |
The number of endpoints that have unresolved recommended content updates. |
|
Optional |
The number of endpoints that have unresolved software, informational, and virus removal content updates. |
Click a widget graph bar to open the Content page, which is filtered to display all unapplied applicable content.
|
Field |
Description |
|---|---|
|
Endpoints |
The number of endpoints with applicable updates within your network. |
|
Applicable updates |
The total number of content items applicable to your endpoints. |
Note:
- If an endpoint is marked as Do Not Patch for an applicable update, that update is no longer considered applicable. Therefore, that endpoint is only included in the graph bars and the Endpoints count if it has other unresolved updates.
- Updates that are globally disabled (or marked Do Not Patch for all endpoints) are excluded from the widget bars and Applicable updates count.
- Updates that are marked Do Not Patch for at least one endpoint (but not all) are still included in the widget bars and Applicable updates count.
The Incomplete Deployments Widget
This widget displays all deployments with elapsed start dates and a status of not started or in progress.
|
Field |
Description |
|---|---|
|
<25% |
The number of deployments that are less than 25 percent complete. This field includes deployments that have not started. |
|
25% - 49% |
The number of deployments that are 25 to 49 percent complete. |
|
50% - 69% |
The number of deployments that are 50 to 69 percent complete. |
|
70% - 79% |
The number of deployments that are 70 to 79 percent complete. |
|
80% - 89% |
The number of deployments that are 80 to 89 percent complete. |
|
>90% |
The number of deployments that are more than 90 percent complete. |
|
Total |
The total number of deployments that have a status of in progress or not started with an elapsed start time. |
|
Total affected endpoints |
The total number of endpoints receiving pending or in-progress deployments. |
The Last 5 Completed Scan Jobs Widget
This widget contains information about the last five completed discovery scan jobs. Each job name is a link to the associated Result page.
|
Column |
Description |
|---|---|
|
Name |
The job name. Click the name to open the Results page for the job. |
|
Completed Date |
The date and time the job completed on the server. |
|
Status |
The status of the completed job. |
The Latest News Widget
This widget displays important announcements and other information in Ivanti Endpoint Security.
Click a link to view additional details about an announcement.
The Mandatory Baseline Compliance Widget
This widget displays the Mandatory Baseline status for all endpoints that have the Patch and Remediation module installed.
|
Field |
Description |
|---|---|
|
Compliant |
The number of endpoints with all Mandatory Baseline content installed. Endpoints that don't have Mandatory Baseline content installed that's marked Do Not Patch are considered compliant. |
|
In process |
The number of endpoints currently downloading Mandatory Baseline content. |
|
No baseline |
The number of endpoints with no content assigned to their Mandatory Baselines. |
|
Non compliant |
The number of endpoints that do not have all content in their Mandatory Baselines installed. |
|
Total number of endpoints |
The number of endpoints with an agent installed. |
The Mobile Endpoint Last Check In Widget
This widget displays your mobile endpoints, which are grouped by the duration or their last check in.
The total number of mobile endpoints is grouped into six different time categories. Click the graph to open the Mobile Endpoints page, which will be sorted by date with the oldest endpoints listed on top.
|
Graph Bar |
Description |
|---|---|
|
1 day (Green) |
The number of mobile endpoints that last checked in one day ago. |
|
2 days (Light Green) |
The number of mobile endpoints that last checked in two days ago. |
|
3 days (Blue) |
The number of mobile endpoints that last checked in three days ago. |
|
4-7 days (Yellow) |
The number of mobile endpoints that last checked in four to seven days ago. |
|
8-14 days (Orange) |
The number of mobile endpoints that last checked in 8 to 14 days ago. |
|
14+ days (Red) |
The number of mobile endpoints that last checked in 14 days ago or more. |
The Mobile Endpoint Status Widget
This widget shows the last known status of all registered mobile endpoints. A pie chart displays the percentage of endpoints in each status.
|
Status |
Description |
|---|---|
|
Online |
The number of endpoints that have checked in within the set communication interval without issue. |
|
Online Jailbroken |
The number of jailbroken iOS endpoints that have checked in within the set communication interval. |
|
Online Rooted |
The number of rooted Android endpoints that have checked in within the set communication interval. |
|
Offline |
The number of endpoints that have not checked in within the set communication interval. |
|
Disabled |
The number of disabled mobile endpoints. |
|
Unmanaged |
The number of mobile endpoints that have their profile removed or the app uninstalled. |
|
Expired |
The number of endpoints issued an expired license. |
|
Wiped |
The number of endpoints that have been sent a command to revert to factory settings. |
|
Total mobile endpoints |
The total number of mobile endpoints registered with Ivanti Endpoint Security. |
Click an endpoint status to open the Mobile Endpoints page, which is filtered to display the clicked endpoint status.
The Mobile Endpoints with Policy Widget
This chart displays all mobile endpoints and their policy assignment status.
This table describes each widget bar.
|
Bar |
Description |
|---|---|
|
No Policy |
The number of mobile endpoints that have no policy assignments. |
|
Blocked |
The number of mobile endpoints that have policy assignments that are not being enforced because the endpoint has a status of Unmanaged, Offline, or Expired. |
|
Pending |
The number of mobile endpoints that have had a policy assignment that has not yet been applied. |
|
Applied |
The number of mobile endpoints that have a policy assignment applied successfully. |
The Next 5 Pending Scan Jobs Widget
This widget displays information about the next five pending discovery scan jobs.
|
Column |
Description |
|---|---|
|
Name |
The job name. Click the link to view the Discovery Scan Jobs page Scheduled tab. |
|
Scheduled Time |
The date and time the job is scheduled for on the server. |
Click a job name link to view the Discovery Scan Jobs page Scheduled tab.
The Offline Patch Endpoints Widget
This widget displays all offline Patch and Remediation endpoints. These endpoints are grouped by time ranges since they last checked in.
|
Field |
Description |
|---|---|
|
< 48 hours |
The number of Patch and Remediation endpoints offline fewer than 48 hours. |
|
48 - 72 hours |
The number of Patch and Remediation endpoints offline 48 to 72 hours. |
|
> 72 |
The number of Patch and Remediation endpoints offline greater than 72 hours. |
|
Total number of offline agents |
The number of Patch and Remediation endpoints that are offline (since their last scheduled Discover Applicable Updates task). |
Clicking the Offline Patch Endpoints widget pie chart opens the Endpoints page Patch and Remediation tab, which is filtered to display offline patch endpoints.
The Patch Agent Module Status Widget
This widget displays all endpoints with the Patch and Remediation module installed, which are grouped by Patch and Remediation status.
|
Field |
Description |
|---|---|
|
Working |
The number of Patch and Remediation endpoints that are working on a deployment task. |
|
Idle |
The number of Patch and Remediation endpoints that are idle. |
|
Disabled |
The number of Patch and Remediation endpoints that are disabled. |
|
Sleeping |
The number of Patch and Remediation endpoints that are sleeping. |
|
Offline |
The number of Patch and Remediation endpoints that are offline. |
|
Disabled |
The number of Patch and Remediation endpoints that are disabled. |
|
Agents with PR module installed. |
The number of endpoints with the Patch and Remediation module installed. |
|
Total Agents |
The total number of Patch and Remediation endpoints in your network. |
Tip: Click the graph to open the Endpoints page Ivanti Patch and Remediation tab.
The Scheduled Deployments Widget
This widget displays endpoints that have not-yet installed applicable content. These endpoints are divided in to two categories: endpoints with deployments scheduled and endpoints with deployments not scheduled. These categories are further divided into three categories: endpoints with not-yet applied critical content, endpoints with not-yet applied recommended content, and endpoints with not-yet applied optional content.
Orange graph bars indicate endpoints that are not scheduled to receive applicable content, while blue graph bars indicate endpoints that are scheduled to receive applicable content.
|
Graph Bar |
Description |
|---|---|
|
Critical |
The number of endpoints scheduled or not scheduled to receive deployments for critical content. |
|
Recommended |
The number of endpoints scheduled or not scheduled to receive deployments for recommended content. |
|
Optional |
The number of endpoints scheduled or not scheduled to receive deployments for optional content. |
Clicking the Scheduled Deployments widget opens the Deployments and Tasks page, which is filtered to display scheduled deployments.
Scheduled Deployments Widget Field:
|
Field |
Description |
|---|---|
|
Endpoint with unresolved updates |
The number of endpoints with unresolved updates. |
The Server Information Widget
This widget lists your serial number, number of licenses available, number of licenses in use, and information about current license usage and availability.
Server Information Widget Fields:
|
Field Name |
Description |
|---|---|
|
Company |
The company your server is registered to as defined during installation. |
|
Serial Number |
The license number (serial number) assigned to your server. |
|
License Replication |
The subscription status between your server and the Global Subscription Service (GSS). |
|
System Replication |
The system replication status between your server and the GSS. |
|
Patch / Content Replication |
The replication status between your server and the GSS. |
|
Package Replication |
The number of packages remaining for replication. |
|
Auto-download New Critical Packages |
The indication of whether your automatically downloads packages for critical vulnerabilities. Click the link to open the Subscription Service Configuration dialog. For additional information refer to Configuring the Service Tab. |
Product Licenses Table Columns:
|
Column |
Description |
|---|---|
|
Product Module |
The module for which you purchased licenses. |
|
In Use |
The number of module licenses in use. |
|
Pending |
The number of licenses pending use or pending removal. Licenses pending removal become available upon removal completion. |
|
Available |
The number of licenses available. |
A license expiration notice displays if all available licenses are expired.
The Time Since Last DAU Scan Widget
This widget displays all active agents (not including disabled or offline) grouped by the amount of time since their last Discover Applicable Updates task.
|
Field |
Description |
|---|---|
|
< 24 hours |
The number of agents that last performed a Discover Applicable Updates (DAU) task and checked in fewer than 24 hours ago. |
|
24 - 47 hours |
The number of agents that last performed a DAU task and checked in 24 to 47 hours ago. |
|
48 - 72 hours |
The number of agents that last performed a DAU task and checked in 48 to 72 hours ago. |
|
> 72 hours |
The number of agents that performed a DAU task and last checked in greater than 72 hours ago. |
|
Never checked in |
The number of agents that have registered yet have not completed a DAU task. |
|
Total active agents |
The total number of active agents. |
Click the Time Since Last Agent Scan widget graph to open the Endpoints page, which is filtered to display enabled endpoints.
The Un-remediated Critical Vulnerabilities Widget
This widget displays the total number of un-remediated critical vulnerabilities that are applicable to your environment grouped by age.
Un-remediated Critical Vulnerabilities Widget Graph:
|
Graph Bar |
Description |
|---|---|
|
<30 days |
The number of un-remediated critical but not superseded vulnerabilities applicable in your network fewer than 30 days old. |
|
30 - 120 days |
The number of un-remediated critical but not superseded vulnerabilities applicable in your network that are 30 to 120 days old. |
|
>120 days |
The number of un-remediated critical but not superseded vulnerabilities applicable in your network greater than 120 days old. |
Click the graph to open the Vulnerabilities page, which is filtered to display critical but not superseded applicable vulnerabilities.
Un-remediated Critical Vulnerabilities Widget Fields:
|
Field |
Description |
|---|---|
|
Critical Vulnerabilities |
The number of critical but not superseded vulnerabilities applicable in your network. |
|
Endpoints |
The number of endpoints with critical but not superseded applicable vulnerabilities. |
Note:
- Vulnerabilities that are globally disabled (or marked Do Not Patch for all endpoints) are excluded from the widget bars and Critical vulnerabilities count.
- Vulnerabilities that are marked Do Not Patch for at least one endpoint (but not all) are still included in the widget bars and Critical vulnerabilities count.
- If an endpoint is marked as Do Not Patch for an applicable vulnerability, that vulnerability is no longer considered applicable. Therefore, that endpoint is only included in the Endpoints count if it has other unresolved updates.
The Endpoints with Unresolved AV Alerts Widget
This widget displays the number of endpoints with unresolved antivirus event alerts.
There are two types of unresolved antivirus event alerts, not cleaned and quarantined. If an endpoint has multiple not cleaned event alerts, it is counted only once in the Not Cleaned column. Likewise, if it has multiple quarantined event alerts, it is counted only once in the Quarantined column. However,
if an endpoint has both not cleaned and quarantined event alerts, it is counted twice (once in each column).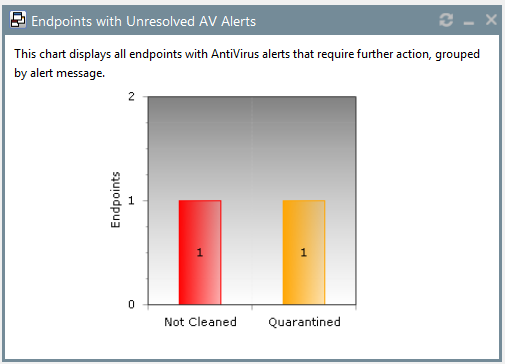
The following table describes each graph bar.
|
Bar |
Description |
|---|---|
|
Not Cleaned |
The number of endpoints with not cleaned event alerts. |
|
Quarantined |
The number of endpoints with quarantined event alerts. |
|
Clicking a widget graph bar opens the Virus and Malware Event Alerts page, which is filtered on the endpoint name. |
|
The Top 10 Infected Endpoints Widget
This widget displays the 10 endpoints which have received the most event alerts in the last 10 days, and a breakdown of each endpoint's alert status.
The widget lists all event alert types, including cleaned, not cleaned, deleted, and quarantined.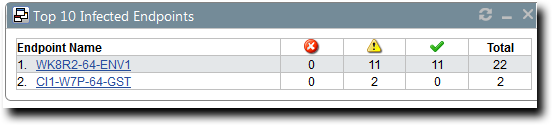
The following table describes each column in the widget.
|
Column |
Description |
|---|---|
|
Endpoint Name |
The name of the endpoint, with a link to its Details page. |
|
Not Cleaned |
The number of alerts on the endpoint where it was not possible to clean a suspect file. |
|
Quarantined |
The number of alerts on the endpoint where the file was moved to quarantine. |
|
Cleaned |
The number of alerts on the endpoint where a file was successfully cleaned. |
|
Deleted |
The number of alerts on the endpoint where a suspect file was deleted. |
|
Total |
The total number of all alerts on the endpoint. This is the number on which the ranking of the list is based. |
The Top 10 Virus/Malware Threats Widget
This widget displays the 10 types of virus or malware that have generated the most event alerts in the last 10 days.
The malware types are listed from the top down in descending order of frequency, and the number of endpoints affected is displayed along the bottom of the widget.
The display is based on the number of event alerts generated by each virus/malware type, regardless of how the event was handled (cleaned, not cleaned, deleted, or quarantined).
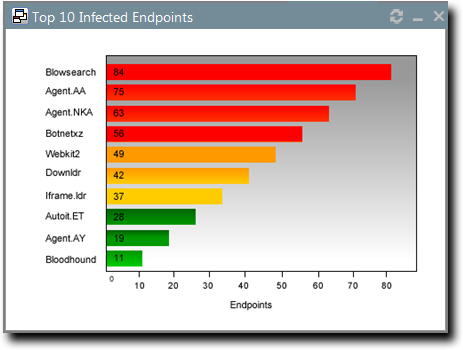
Clicking on any virus/malware bar will bring you to its Virus/Malware Details page.
The Estimated Energy Savings: Daily Widget
This widget displays the energy savings for the previous day. This calculation is based on your endpoints actual power consumption compared to the energy usage if the same endpoints were in an always-on state.
|
Field |
Description |
|---|---|
|
Results for the day of |
The date for which the widget displays the results. |
|
Desktop count |
The number of monitored desktops. |
|
Total usage |
The percentage of time that the monitored desktops are switched on versus desktops in an always-on state. The value in parenthesis is the kilowatt hours of electricity used. |
|
Total savings |
The total savings amount for desktops. |
|
Laptop count |
The number of monitored laptops. |
|
Total usage |
The percentage of time that the monitored laptops are switched on versus desktops in an always-on state. The value in parenthesis is the kilowatt hours of electricity used. |
|
Total savings |
The total savings amount for laptops. |
The Estimated Energy Savings: Weekly Widget
This widget displays the energy savings of the past seven days based on your endpoints’ actual power consumption compared to the energy usage if the same endpoints were in an always-on state.
|
Field |
Description |
|---|---|
|
Results for the week from |
The dates for which the widget displays the results. |
|
Desktop count |
The number of monitored desktops. |
|
Total usage |
The percentage of time that the monitored desktops are switched on versus desktops in an always-on state. The value in parenthesis is the kilowatt hours of electricity used. |
|
Total savings |
The total savings for desktops. |
|
Laptop count |
The number of monitored laptops. |
|
Total usage |
The percentage of time that the monitored laptops are switched on versus desktops in an always-on state. The value in parenthesis is the kilowatt hours of electricity used. |
|
Total savings |
The total savings amount for laptops. |
The Estimated Energy Savings: Monthly Widget
This widget displays the energy savings of the past 30 days based on your endpoints actual power consumption compared to the energy usage if the same endpoints were in an always-on state.
The following table describes the fields in the Estimated Energy Savings: Monthly widget.
|
Field |
Description |
|---|---|
|
Results for the month from |
The month for which the widget displays the results. |
|
Desktop count |
The number of monitored desktops. |
|
Total usage |
The percentage of time that the monitored desktops are switched on versus desktops in an always-on state. The value in parenthesis is the kilowatt hours of electricity used. |
|
Total savings |
The total savings amount for desktops. |
|
Laptop count |
The number of monitored laptops. |
|
Total usage |
The percentage of time that the monitored laptops are switched on versus desktops in an always-on state. The value in parenthesis is the kilowatt hours of electricity used. |
|
Total savings |
The total savings amount for laptops. |
The Device Control Denied Actions Widget
This widget displays the users with the highest number of actions blocked by device control policies. View this widget when determining the lists of users for whom action block occurred due to the device control policies.
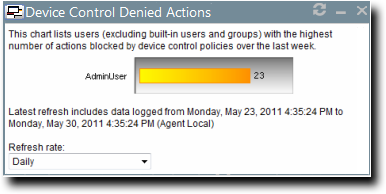
The chart displays the users with the highest number of actions blocked by device control policies. The widget can displays five users with the highest number of actions blocked by device control policies. The count on the bar displays the number of times the user actions were blocked by the device control policies.
The Devices Connected to Endpoints Widget
This widget displays the number of peripheral device classes that were connected to endpoints. View this widget when determining which devices were connected to endpoints over the last week.
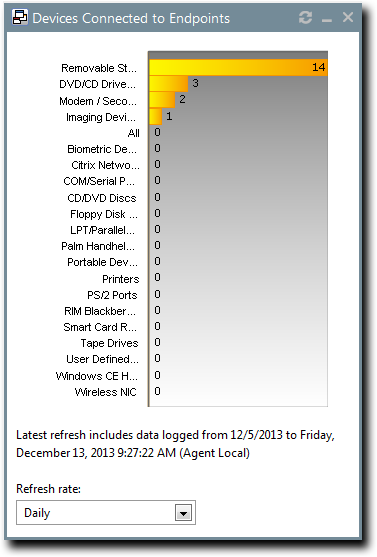
The chart displays the number of devices in each device class connected to the endpoints. The count on the bar displays the number of devices in a particular device class that were connected to the endpoints.
Dashboard Setting and Behavior Icons
Setting and behavior icons are UI controls used to manage the dashboard. Click these icons to maximize, minimize, hide, and refresh the dashboard and widgets.
The following table describes each icon action.
|
Icon |
Action |
|---|---|
|
|
Opens the Dashboard Settings dialog. |
|
|
Opens the dashboard in print preview mode. |
|
|
Collapses the associated widget. |
|
|
Expands the associated collapsed widget. |
|
|
Hides the associated widget. |
|
|
Refreshes the associated widget (or the entire dashboard). |
Not all widgets contain Refresh icons.
Previewing and Printing the Dashboard
When viewing the dashboard, you can reformat it for printing. This reformat omits the Web site header and footer, reorganizing the dashboard to display only the selected widgets, making it ideal for printing.
- From the Navigation Menu, select Home.
- Click
 .
.
The dashboard print preview opens in a new Web browser window. - [Optional] Use your Web browser controls to print the dashboard.
Editing the Dashboard
You can customize how widgets are arranged and prioritized. Edit the dashboard to display only the widgets useful in your environment.
Edit the dashboard from the Dashboard Settings dialog.
- From the Navigation Menu, select Home.
- Click
 .
.
The Dashboard Settings dialog opens. - Choose which widgets you want to display on the dashboard.
- Select widget check boxes to display them.
- Clear widget check boxes to hide them.
- Prioritize the widgets in the desired order.
- Click
 to increase a widget priority.
 - Click
 to decrease a widget priority.
Highly prioritized widgets are more prominently placed.
- Click
- Display or hide widget descriptions.
- Click
 to display descriptions.
 - Click
 to hide descriptions.
- Click
- Choose a widget layout.
- Click
 to display widgets in two columns.
 - Click
 to display widgets in three columns.
- Click
- Click OK.
Your dashboard settings are saved. The Home page displays the selected widgets in the priority you defined.
The System Alert Pane
The System Alert pane displays information about changing conditions in your environment. This pane alerts you to required actions and links to related help topics.
The System Alert pane displays in the dashboard and shows the number of alerts that require your attention.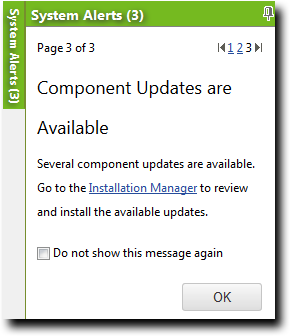
The following functions can be found in the System Alert pane.
|
Option |
Description |
|---|---|
|
Pin (icon) |
Docks the System Alert pane. Clicking this icon again collapses it. |
|
Pagination Links |
Allows you to navigate between alerts. For more information, seeAdvancing Through Pages. |
|
Action Link |
Opens the appropriate application page, external Web page, or context-sensitive help topic, depending on the action specified in the alert. |
|
Don't show this again (check box) |
Collapses the System Alert pane. The alert shown in the System Alert pane when this check box is selected will no longer be shown. |
|
OK (button) |
Collapses the System Alert pane. |
Note:
- Dismissing a notification only dismisses the notification for logged in user. The notification still displays for others.
- The system automatically dismisses alerts as you complete their related actions, regardless of whether you dismiss the alerts.
License Expiration
When licensing for a module expires, the module behavior changes. All functionality is restored when the licensing is renewed.
When a subscription expires, the module history and configuration is retained. No work is lost when the module is renewed.
License Expiration Scenario and Events:
|
Scenario |
Event(s) |
|---|---|
|
Server Module Expiration |
|
|
Endpoint Module Expiration |
|
License Expiration Scenario and Events for Mobile Endpoints:
|
Scenario |
Event |
|---|---|
|
Mobile Endpoint Module Expiration |
Endpoints in an Offline or Wiped status hold their license until deleted. |
To reactivate your licenses following renewal, open the Subscription Updates page and click Update Now. Your server replicates updated subscription information. The page refreshes when the update completes, and all previous module functionality is restored.
For more information about renewing or adding licenses, contact Ivanti Sales Support ([email protected]).