Using the Patch Module for Endpoints
In this section:
The Patch Module is the software that executes Ivanti Patch and Remediation functions on an endpoint.
When added to the Ivanti Endpoint Security Agent, the Patch Module scans the endpoint for vulnerabilities and uploads the scan results to Ivanti Endpoint Security. The results returned to Ivanti Endpoint Security server can be viewed at any time,
even if the workstation is disconnected from your network. The scan results are used by Patch and Remediation to determine a vulnerability’s applicability for each endpoint. If a vulnerability is applicable, the Ivanti Endpoint Security Web console displays the endpoint as Not Patched.
After adding the Patch Module, there is generally no additional user interaction required at the endpoint.
About Patch Module for Windows
The Patch Module for Windows communicates Patch and Remediation-related information about the host endpoint to the Ivanti Endpoint Security. The Patch Module is responsible for uploading endpoint data and downloading content.
The Patch Module for Windows 7 and later is managed through the Patch Module Management Console. With this user interface, you can launch Discover Applicable Update tasks, scan the endpoint for system changes, view server information, configure proxy servers, and so on. You can install Patch Module for Window 7 and later on the following endpoint operating systems:
- Windows 10
- Windows 8.1
- Windows 8
-
Windows 7
- Windows Server 2012 R2
- Windows Server 2012
- Windows Server 2008 R2
Viewing the Patch Module
Viewing the Patch Module provides access to module functionality and connectivity data. Open the Patch Module from the endpoint hosting it.
- Open Windows Control Panel.
Windows Control Panel opens. - Open the Ivanti Endpoint Security Agent.
- Select the Ivanti Patch and Remediation panel.
- Click Ivanti Patch Module.
The Patch Module Management Console opens to the Home page.
The Patch Module Management Console
You can use this console to configure behavior for the Windows version of the Patch Module. You can also use it to view communication data between the module and server.
This console includes the following information and settings:
- The Home Page
- Tools and Settings
- Proxy Settings
- Configuring Client Proxy Settings
- Log Files
- Notification Manager
- Server Settings
The Management Console Toolbar
Within the Patch Module Management Console , a toolbar is displayed. Use this toolbar to navigate within the Patch Module or perform module actions.
The following table describes each Patch Module Management Console toolbar button.
|
Button Title |
Button |
Description |
|---|---|---|
|
Backward |
|
Returns you to the previously used Management Console information or settings. |
|
Forward |
|
Advances you to the information or settings you viewed prior to clicking Backward. |
|
Scan |
|
Launches an endpoint scan for system changes, which are uploaded to the server. Click the arrow to expand a menu. |
|
Scan > Scan |
N/A |
Launches an endpoint scan for system changes, which are uploaded to the server |
|
Scan > Check for Deployments |
N/A |
Launches check-in with the server for endpoint deployments. If a deployment is scheduled, you can complete it using Notification Manager controls. |
|
Scan > Deployment Service |
N/A |
Opens the a dialog you can use to restart the Ivanti Patch Module service. |
|
Tools |
|
Opens Tools and Settings. For additional information, refer to Tools and Settings. |
|
? |
|
Opens Help for Patch Module Management Console. Click the arrow to expand a menu. |
|
? > Help |
N/A |
Opens Help for the Patch Module Management Console. |
|
? > Exit the Control Panel |
N/A |
Closes the Patch Module Management Console. |
|
? > About the Control Panel |
N/A |
Opens the About dialog. This dialog lists the Patch Module trademark information. |
The Home Page
The Patch Module Management Console opens to the Home page. This page lists module information and function.
The Home page includes:
The Home Page features a Compliance Banner, which lists the status of the deployment service. This banner displays whether the endpoint is compliant with corporate policies.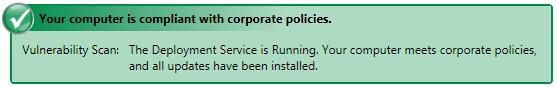
The following table describes each possible status.
|
Color |
Status |
|---|---|
|
Green |
Your computer is compliant with corporate policies The deployment service is running. Your computer meets corporate policies, and all updates are installed on your computer. |
|
Orange |
The module is determining if your computer is still compliant with corporate policies The deployment service is performing a vulnerability detection. |
|
Red |
The module is unable to determine your computer's compliance with corporate policies The deployment service is stopped and the module is offline. |
|
Orange |
Your computer is not compliant with corporate policies The deployment service is running and your computer requires a reboot to finish installing updates. |
|
Blue |
Your computer has not been able to contact the management server The deployment service is running and the module is in an unknown state. |
Active Scan Statistics display only after clicking the Scan button. You can use the active scan statistics controls to start a scan if one is not already active. This section also displays the scan type, start time, duration, and status.
|
Field |
Description |
|---|---|
|
Scan Type |
The type of scan that was performed. |
|
Start Time |
The time the scan was started. |
|
Duration |
The amount of time the scan lasted in minutes and seconds. |
|
Signatures Evaluated |
The phase of scan in progress. |
The scan start time and duration values are only populated if you started the scan. If the scan was running prior to you clicking the Scan button, the exact start time and duration are unknown.
Status fields indicate when the last endpoint scan took place.
|
Field |
Description |
|---|---|
|
Last scan |
The date and time of the last scan. |
|
Update schedule |
The communication interval between the module and server. |
|
Definition date |
The date and time of the definition file. |
|
Patch module version |
The version of the Patch Module installed and the date of installation. |
Tools and Settings
Tools and Settings includes links to module configuration settings and utilities.
Tools and Settings can be expanded or collapsed by their arrow icons. The following links appear in Tools and Settings.
|
Link |
Description |
|---|---|
|
Settings |
|
|
Proxy Settings |
Opens Proxy Settings , allowing you to view of modify the module proxy configuration. For additional information, refer to Proxy Settings. |
|
Logging |
Opens Log Files , allowing you to view or clear the module log files. For additional information, refer to Log Files. |
|
Notification Manager |
Opens Notification Manager , allowing you to define the Notification Manager behavior. For additional information, refer to Notification Manager. |
|
Tools |
|
|
Ivanti Endpoint Security Server |
Opens Server Settings , which lists information about your server. For additional information, refer to Server Settings. |
Proxy Settings displays information about the proxy server used to download content and reroute communications between your server and the agent. You can also use the settings to define the proxy server manually.
Proxy Settings is divided into two sections:
When installed, the Patch Module controls all communication with a proxy server rather than the Ivanti Endpoint Security Agent.
Server Provided Proxy Settings
This Proxy Settings section lists the FastPath server that the endpoint is currently using to route communication with the server, if applicable. FastPath servers are caching proxies applied to the endpoint by agent policy set.
You can expand or collapse this section by clicking the rotating chevron (>).
When the Server Provided Proxy Settings section is expanded, a table displays. This table lists information about each FastPath server assigned to the endpoint. For additional information about FastPath servers and how to assigned them to Patch and Remediation endpoints, refer to About FastPath.
|
Column |
Description |
|---|---|
|
Server |
Lists the name of the FastPath server. |
|
Port |
Lists the FastPath server port used to route server and endpoint communications. |
|
Authenticated |
Lists whether the FastPath server requires authentication (Yes or No). |
Server Provided Proxy Settings also includes the Use a Proxy Server check box. If your administrator has not assigned any FastPath servers to the endpoint, you can select this check box to manually define a proxy. For additional information, refer to Configuring Client Proxy Settings.
This Proxy Settings section lists client provided proxy settings. You can define these settings after selecting the Use a Proxy Server check box in Server Provided Proxy Settings.
You can expand or collapse this section by clicking its associated arrow icon.
The following table describes each field you can define within Client Defined Proxy Settings.
|
Field |
Description |
|---|---|
|
Proxy Server Address |
The name or IP address of the proxy server you want to use to route communication between the server and the endpoint. |
|
Proxy Server Port |
The port number the proxy server uses to route communication. |
The Client Defined Proxy Settings section contains a sub-section, the Proxy Authentication section. When defining client proxy settings, define these settings if the proxy requires authentication.
To define these settings, select the Enter your proxy authentication credentials check box and type values into the fields described in the following table, which become available after selecting the check box.
|
Field |
Description |
|---|---|
|
Username |
A username that authenticates with the proxy. |
|
Password |
The username password. |
|
Password Retyped |
The password retyped. |
Configuring Client Proxy Settings
If your Ivanti Endpoint Security administrator has not assigned your endpoint a FastPath server, you can configure the Patch Module to use a proxy server of your choice.
Tip: Ivanti recommends assigning proxy servers by Agent Policy Set instead. For additional information, refer to About FastPath.
Define proxy settings from the Proxy Settings options in the Patch Module Management Console.
- From the toolbar, click Tools.
Tools and Settings open. - Click Proxy Settings.
Proxy Settings open. - Ensure Server Provided Proxy Settings is expanded.
- Ensure the Use a proxy server check box is selected.
If this check box is unavailable, you cannot define a proxy server because your administrator has already defined proxy servers using FastPath.
- Ensure Client Provided Proxy Settings is expanded.
- Define the following fields by typing the applicable information in them. The following table describes each field.
- If the defined proxy require authentication, ensure Proxy Authentication, select the Enter your proxy authentication credentials, and type the applicable information in the following fields:
- Click Save.
|
Field |
Description |
|---|---|
|
Proxy Server Address |
The name or address of the proxy server you want to use. |
|
Proxy Server Port |
The port number the proxy uses to route server and module communication. |
|
Field |
Description |
|---|---|
|
Username |
A username that authenticates with the proxy. |
|
Password |
The password associated with the username. |
|
Retype Password |
The password retyped. |
The Log Files options contains buttons to open or clear the Patch Module log files.
The following table describes each Logging Files column.
|
Column |
Description |
|---|---|
|
Name |
The name of the log files. |
|
Date Modified |
The date and time the log files were last modified. |
|
Size |
The size of the log files in kilobytes. |
|
Action |
Buttons used to interact with logs.
|
Tip: By default, logs are available at <Program Files>\HEAT Software\HEATAgent\live\patch
You can open Patch Module logging files to review Patch Module events.
Open log files from the Log Files page.
- From the toolbar, click Tools.
Tools and Settings open. - Click Logging.
Log Files opens. - Click the View for the log you want to view.
The log opens in the Log Viewer.Tip:
- Click Refresh to update the log.
- Use the Log Viewer controls to reformat, magnify, or search for text.
Use the Notification Manager options to define how Patch Module notifications display on the endpoint.
The following table describes each Notification Manager setting.
|
Setting |
Description |
|---|---|
|
Notification Manager Version |
Displays the version of the Patch Module Management Console installed on the endpoint. |
|
Always Show Icon in System Tray |
When selected, forces the Notification Manager icon to displays in the Windows system tray. |
Server Settings contain information about the server that the Patch Module is registered with.
The following table describes each Server Settings field.
|
Field |
Description |
|---|---|
|
Ivanti Endpoint Security Server |
The name of the server the Patch Module is registered with. Click the name open the Ivanti Endpoint Security Web console. |
|
Ivanti Endpoint Security Server Version |
The version of the server that the Patch Module is registered with. |
|
Agent Center Version |
The Patch Module Management Console version. |