Service Manager powered by HEAT
About Alerts
•Adding an Alert Bar to Your Home Page or Default Dashboard
About Alerts
An alert is a notice that appears at the top of a dashboard.
Sample Alert Notice

By default, alerts appear in three categories:
•Red: System or application error, such as a performance issue or system shut down.
•Yellow: Warning message, such as users unable to perform certain tasks.
•Blue: Informational message, such as informing users of a printer that has moved.
Creating an Alert
1.Log into the Service Desk Console.
2.Open the Alert workspace. A list of current alerts appears.
3.From the toolbar, click New Alert. A blank alert form appears.
Blank Alert Form
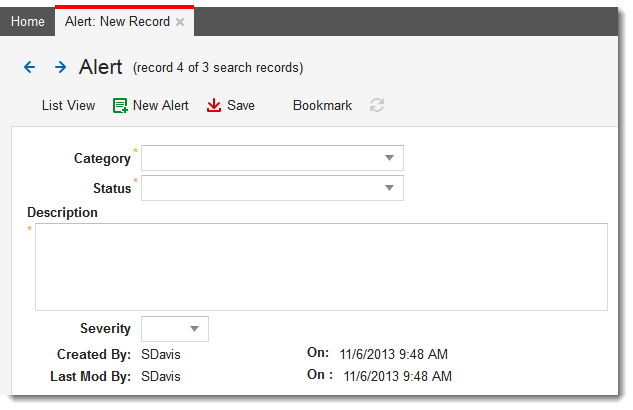
4.Enter information into the fields.
| Field | Description |
|---|---|
|
Category |
The category for this alert. Choose from the drop-down list: Problem Low Disk Space Removed Application Added Application General Unauthorized Change |
|
Status |
The status of this alert. Choose either current or closed from the drop-down list. |
|
Description |
A description of the alert. This text appears in the alert bar. |
|
Severity |
The severity of the alert, which determines the alert severity level. Choose from the drop-down list.
3 (general Information [blue]) 2 (warning [yellow]) 1 (error [red]) |
5.Click Save.
To see the new alert, go to the dashboard containing the alert bar and refresh your browser window. The alert also appears as a message in the Social Board.
Modifying an Alert
1.Log into the Service Desk Console.
2.Open the Alert workspace. A list of current alerts appears.
3.Double-click the alert to change. The alert details appear.
4.Make changes to the alert.
5.Click Save.
Deleting an Alert
1.Log into the Service Desk Console.
2.Open the Alert workspace. A list of current alerts appears.
3.Select the alert to delete.
4.Click the delete icon  from the toolbar.
The alert is no longer listed.
Adding an Alert Bar to Your Home Page or Default Dashboard
You can add an alert to your Home page or default dashboard through the Dashboard Center.
Your administrator defines which roles can create, edit, or delete alerts and dashboards.
1.Log into the Service Desk Console.
2.Click All Dashboards. The system displays a list of dashboards.
3.Click the edit icon  next to the dashboard to which to add the alert bar. (To add it to your Home page, select your default dashboard). The system displays the Dashboard Center.
4.Under Dashboard Objects, click Dashboard Information. The Dashboard Information area expands.
5.At the bottom of the column in the Addins section, check Alerts. This adds an alert bar to the dashboard.
6.Click Save.
Was this article useful?
The topic was:
Inaccurate
Incomplete
Not what I expected
Other
Copyright © 2017, Ivanti. All rights reserved.