Webhooks Logging
Check the Service Log in Ivanti Neurons for ITSM to see whether a request has succeeded or failed.
For general information about how logs work in ITSM, see: Working with Logs
Viewing the Service Log
The Service Log is included by default and lists all the information about requests for services and their status.
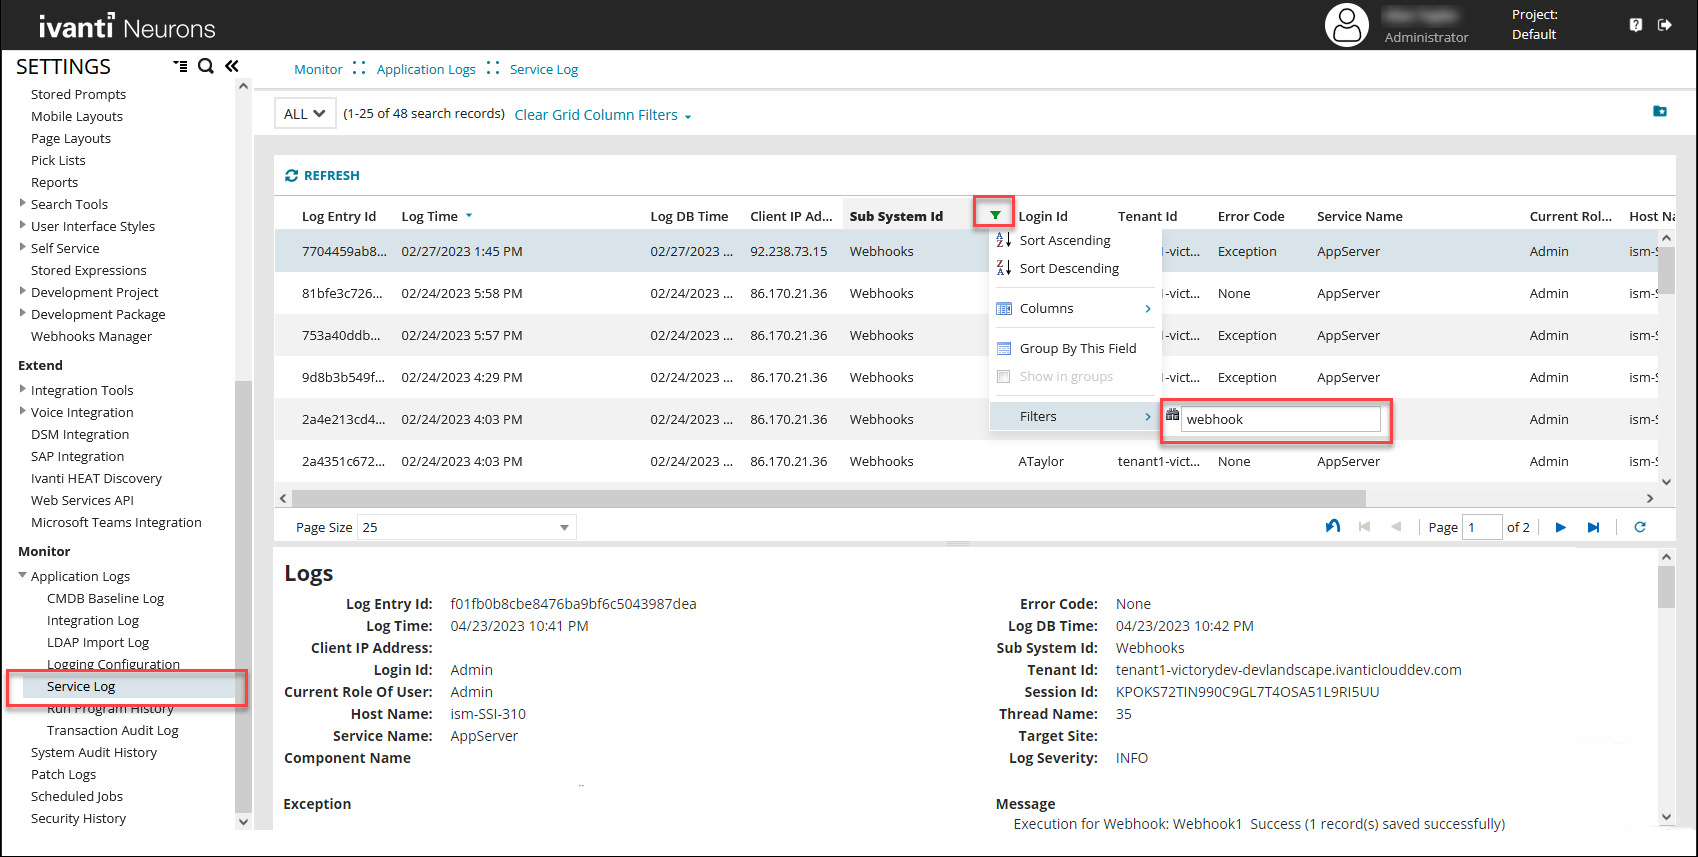
1.From the Configuration Console, click Monitor > Application Logs > Service Log to open the Service Log workspace.
2.The list of services appears.
3.To filter on Webhook services, select the Filter icon  for the SubSystem Id and then enter Webhook in the Filters box.
Tip: You can also filter on Service Name = Appserver. If Appserver is not visible, go to the Logging Configuration and set APPSERVER to ALL. See: Viewing the Logging Configuration.
All requests to the Webhooks service are listed as shown.
4.Double-click a record to see more detail or expand the bottom pane of the workspace.
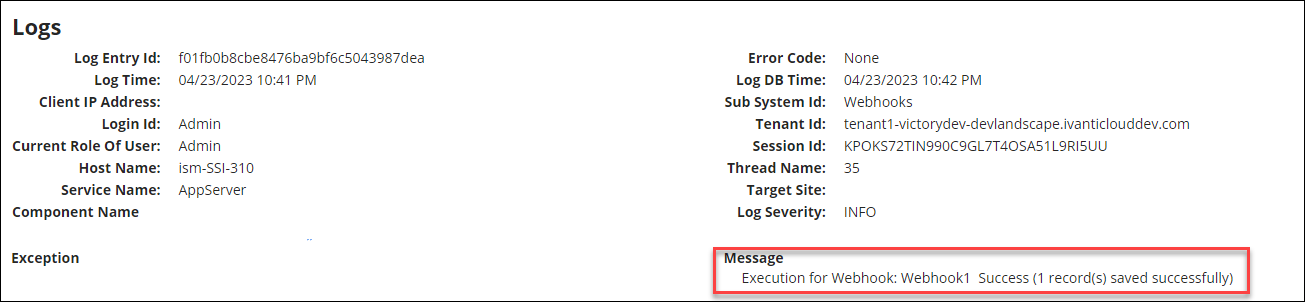
•If a webhook EXECUTE request fails, the Service Log has an entry detailing the reason as to why each record failed, and the HTTP status code. The Log Severity is shown as ERROR.
•If a webhook EXECUTE request succeeds, an entry appears in the log detailing that the request ran and how many records succeeded. The Log Severity is shown as INFO.