Configure Incident Correlation
Role: Administrator and Service Desk Analyst roles.
Minimum Version: Ivanti Neurons for ITSM 2025.2.
Feature Eligibility: Ivanti's AITSM capabilities are available to customers who have subscribed to Premium or Enterprise Premium license. To know your eligibility, reach out to your Ivanti Account Manager.
Ivanti Neurons for ITSM leverages AI to streamline incident management through intelligent grouping of incidents into clusters. The Incident Correlation capability identifies patterns among new, incoming incidents, helping organizations detect major IT service issues quickly.
The Incident Correlation Dashboard empowers incident managers to build a dashboard, view cluster severity, and manage incident clusters efficiently. Users can make a dashboard to monitor correlated incidents, link incidents or unlink incidents, and assign parent incidents. This advanced dashboard service enhances visibility and control, making my dashboard a central hub for proactive incident resolution.
The Incident Correlation Dashboard is available out-of-the-box for all new customers. However, existing customers upgrading to version 2025.2 should set it up.
Configure Incident Correlation Dashboard
The Incident Correlation Dashboard is available to new customers from version 2025.2 by default. Existing customers have to set to it up.
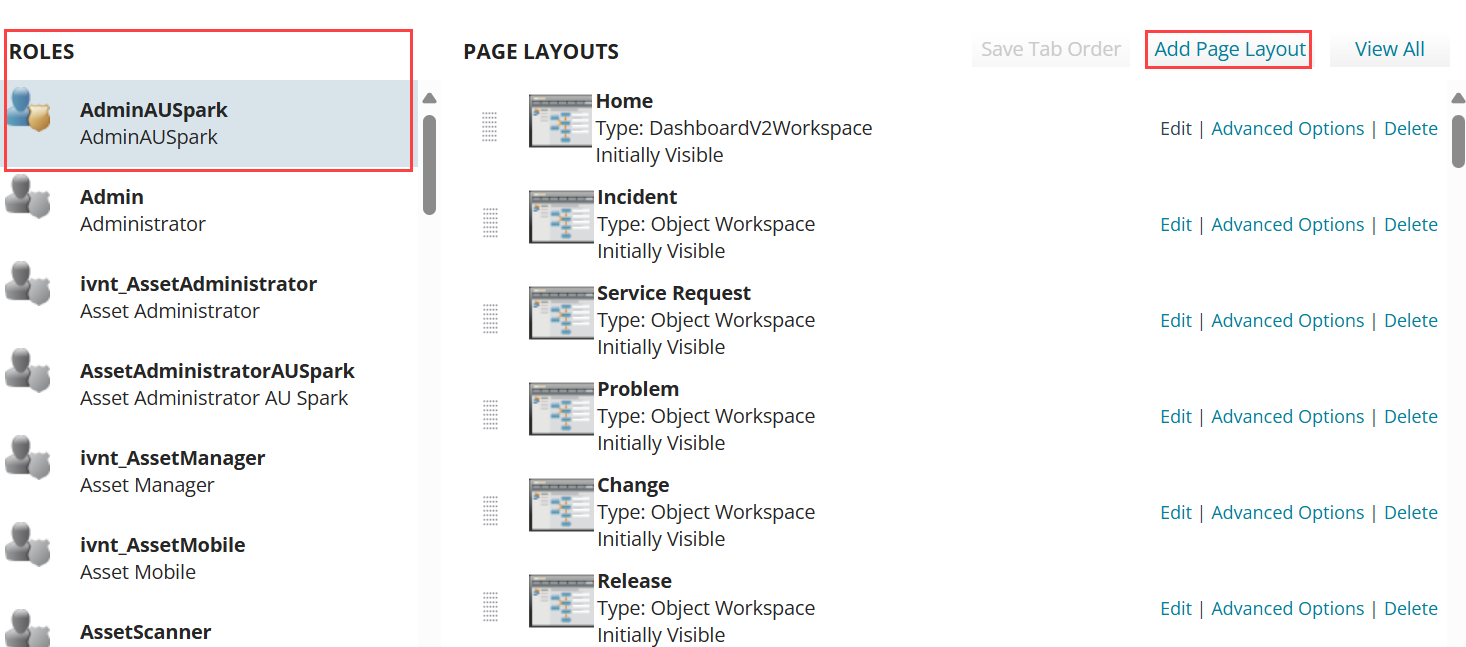
1.From the Configuration console, select Build > Page Layouts.
2.Select the role you want to set it up for under Roles and click Add Page Layout.
Adding the Page Layout
3.Select Incident Correlation, provide necessary info and save.
The Incident Correlation Dashboard is setup and the workspace is now available in the Service Desk console.
Working with Incident Correlation Dashboard
To access the Incident Correlation Dashboard:
•From the Service Desk console, click More > search for Incident Correlation Dashboard and open it.
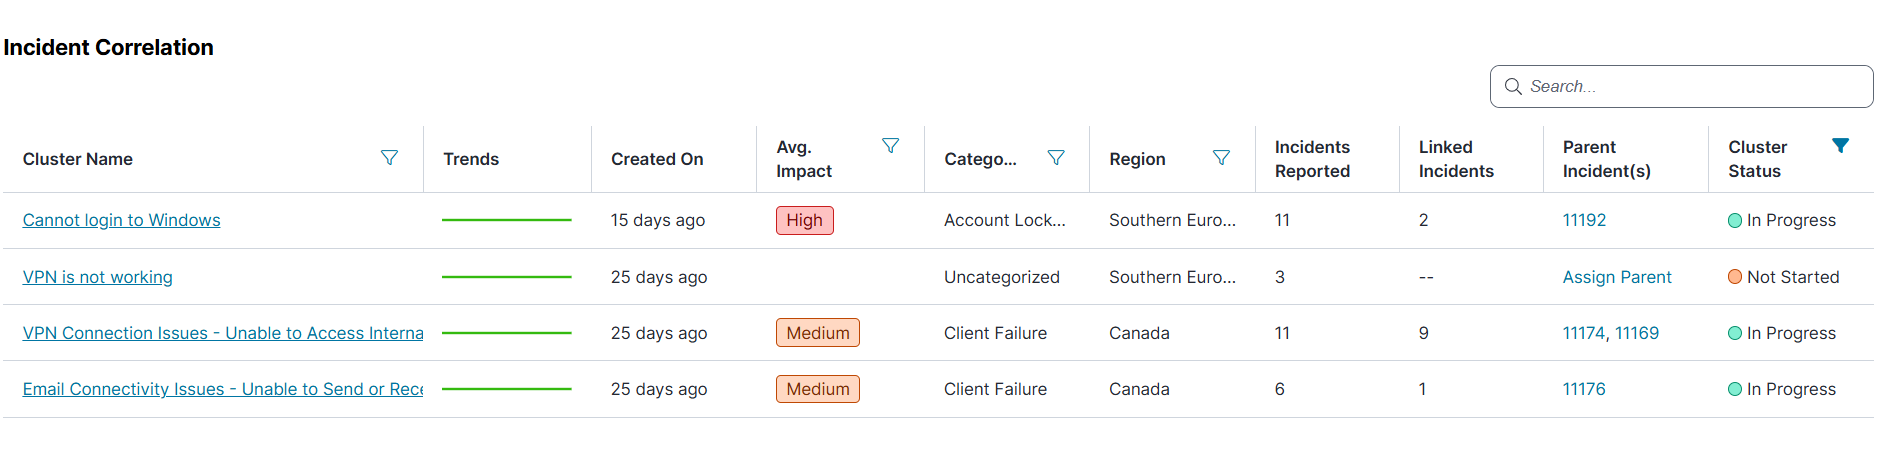
A list of clusters is displayed. You can open any cluster to view more information and make changes.
Incident Correlation Dashboard
Points to Note:
•Administrator can add Incident Correlation Dashboard to any role such as Service Desk Manager or Service Desk Analyst. To do so, enable object-level permissions for the Incident Cluster[nrn_IncidentCluster] Business Object. This ensures the dashboard displays and functions correctly.
•Also add the Incident Correlation tab in the Incident page to view correlated incidents and to navigate to the Dashboard. Refer to Configuring Correlated tab.
Dashboard Columns
The Incident Correlation Dashboard has the following columns:
•Cluster Name - Clickable; opens the Cluster Info page where all the incidents in the cluster is displayed with options to link/unlink incidents and assign parent incident.
•Trends - Dynamic graph with a visual representation of incident flow over time. It is updated every time the page is refreshed. The following are the color definitions:
•Green - When incidents reported are in downward trend, that is if the incidents reported in the last hour is less than the previous hour.
•Red - When incidents reported are in a rising trend, that is if the incidents reported in the last hour exceeds the previous hour.
•Created On - Date the cluster is created.
•Avg Impact - Average priority of incidents in the cluster.
•Category - Category of the grouped incidents.
•Region - Geographical region reporting the incidents.
•Incidents Reported - Total number of incidents in the cluster.
•Linked Incident - Clickable; opens the Cluster details page for managing incidents.
•Parent Incident - Clickable; opens the Cluster details page.
•Cluster Status - Current status of the cluster, with the following states:
•Not Started - When the cluster created.
•In Progress - When an action such as linking incidents or assigning parents is taken.
•Terminated - When the cluster is auto-closed as result of all parent incidents resolved or closed.
Configuring the Correlated Incidents tab
The Correlated Incidents tab is available in the Incident view page. It helps a Service Desk Analyst view the related incidents for resolving incidents faster.
This tab is available for new customers from version 2025.2 by default. However, existing customers have the configure it.
To configure the Correlated Incidents tab:
1.From the Configuration console, select Build > Business Object > Incident > Layouts.
2.Open the layout used for the role you want configure the tab.
3.From the View in this layout section, select formView.
4.Click Add Child Panel with Relation.
5.Enter Correlated Incidents as the tab name.
6.Select Correlated Incidents as the Plugin.
7.Select IncidentClusterAssocIncident in the Relationship column.
Correlated Incidents tab added in the formView page
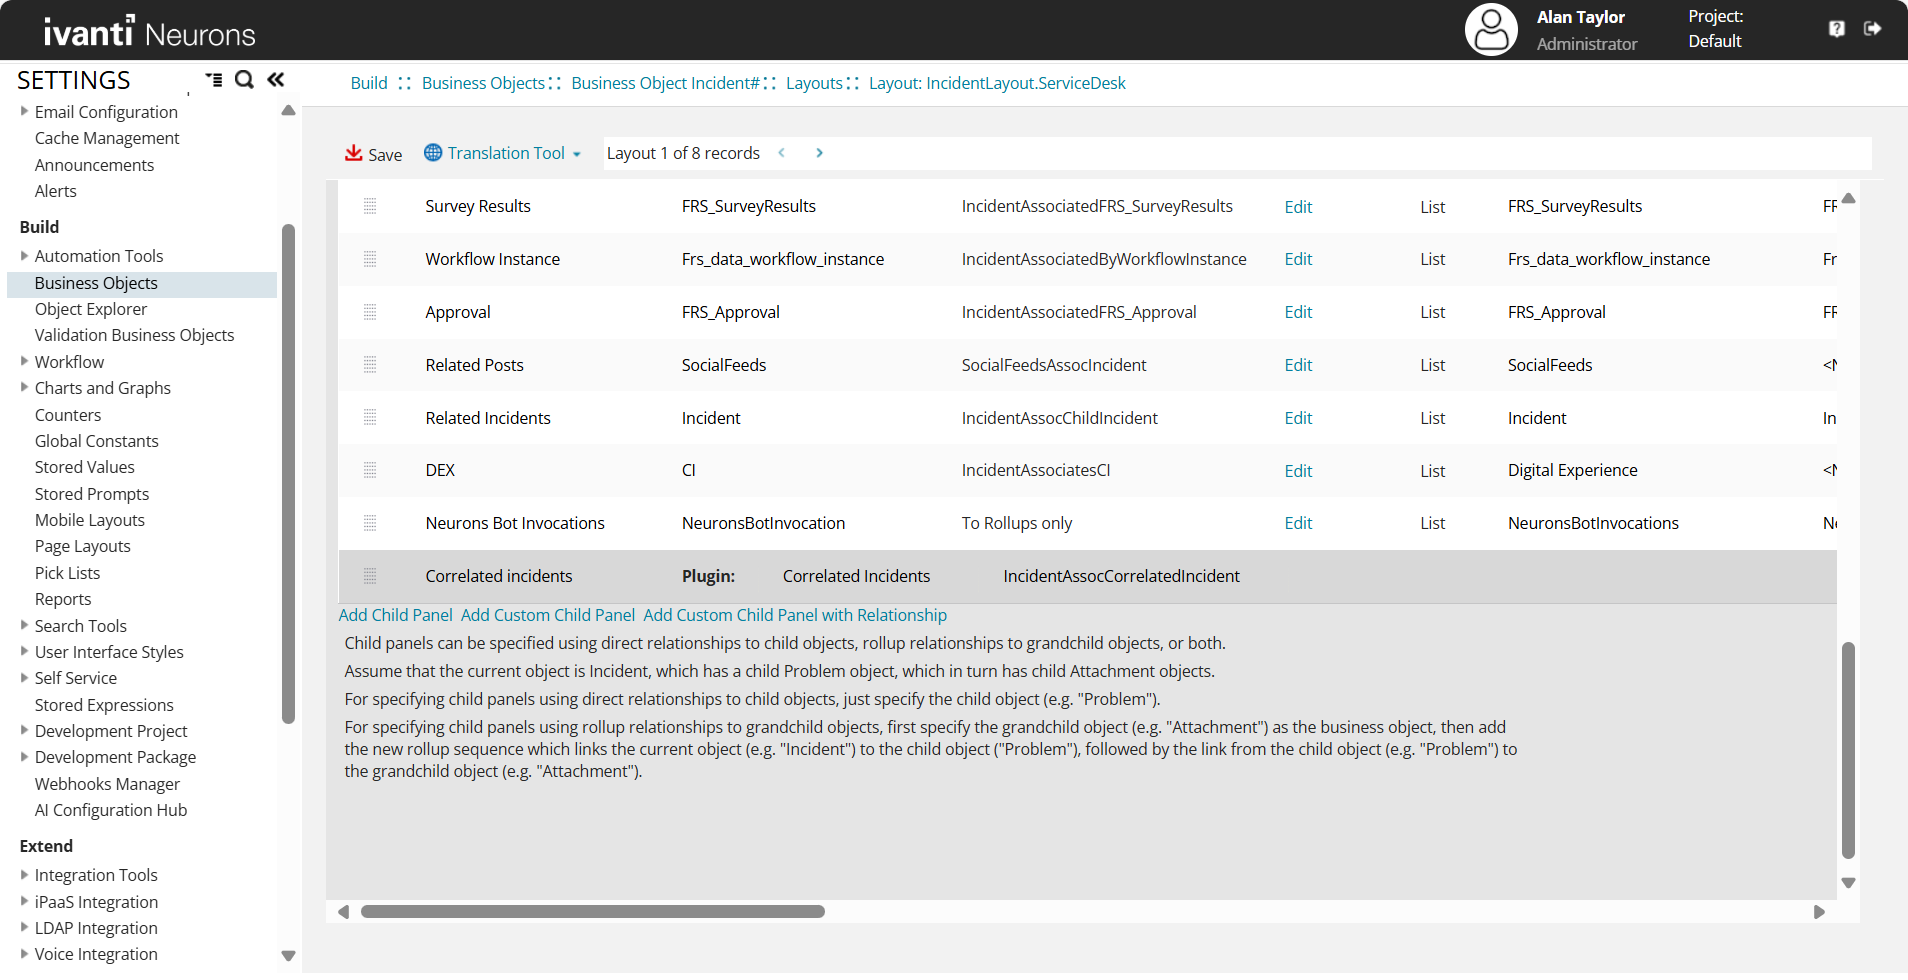
8.Save the changes.
Correlated Incidents tab is now added to the Incident view page for the selected role.