The Executive Dashboard
When you log in to the Service Desk Console as a Portfolio Manager, the system automatically displays the Portfolio dashboard. To see the Executive dashboard, select it from the My Dashboards drop-down list.
Use this dashboard to obtain the following information:
•Information for reporting on Project and Portfolio Overviews, Strategic Objectives, and Financial indicators.
•Open Risks and Open Issues, Open Escalated Risks by Type.
Key to symbols:

|
Refresh the data being shown by the dashboard pane. |

|
Export the chart to a .png image. |

|
Toggle the chart legend on or off. |

|
Maximize this chart pane to full screen. |
Parts of the Dashboard
|
|
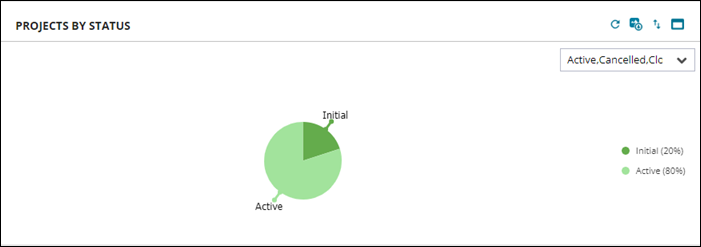
PROJECTS BY STATUS •Click on each section of the pie chart to see a list of projects in that status. •Use the drop-down to select different statuses to filter your projects by. |
|
|
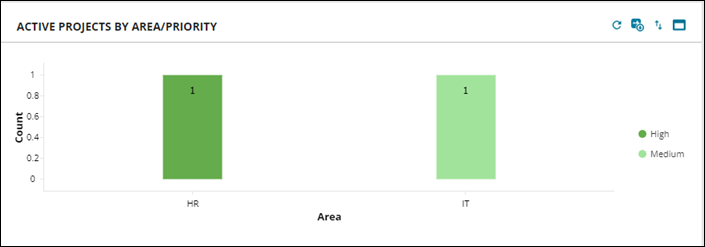
ACTIVE PROJECTS BY AREA/PRIORITY •The Y axis shows the number of Projects and the X axis shows Area, for example, IT or HR. •Priority levels are shown by different colored bars and explained in the legend. •Click on a bar to open the Project record. |
|
|
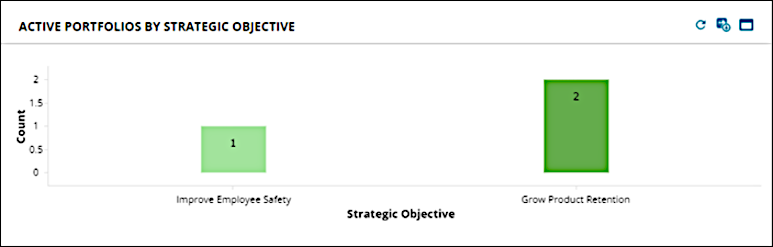
ACTIVE PORTFOLIOS BY STRATEGIC OBJECTIVE •The Y axis shows the number of Portfolios and the X axis shows Strategic Objective, for example, Improve Employee Safety. •Numbers are shown by different colors. •Click on a bar to open the Portfolio record. |
|
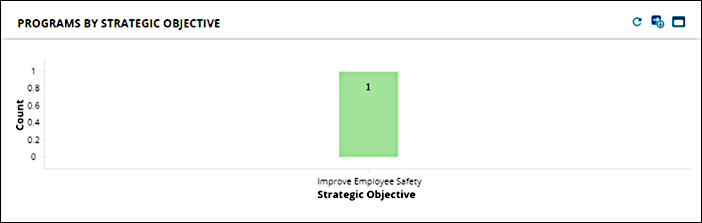
PROGRAMS BY STRATEGIC OBJECTIVE •The Y axis shows the number of Programs and the X axis shows Strategic Objective, for example, Improve Employee Safety. Cancelled Programs are excluded. •Numbers are shown by different colors. Colours do not signify a ranking of any sort. •Click on a bar to open the Program record. |
|
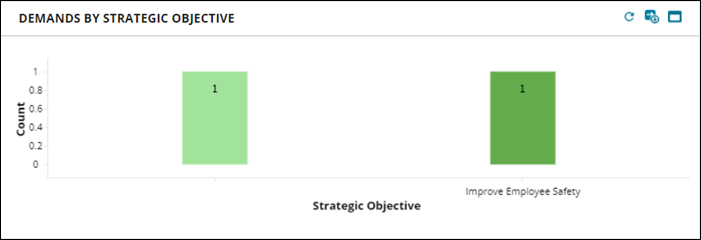
DEMANDS BY STRATEGIC OBJECTIVE •The Y axis shows the number of Demands and the X axis shows Strategic Objective, for example, Improve Employee Safety. Cancelled Demands are excluded. •Numbers are shown by different colors. Colours do not signify a ranking of any sort. •Click on a bar to open the Demand record. |
|
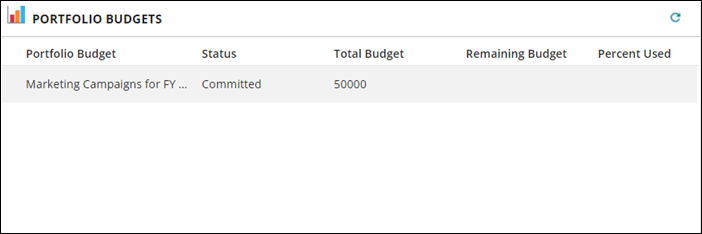
PORTFOLIO BUDGETS •This list view shows each Portfolio along with its current Status and Total Budget. •You can quickly check how much budget is left for each Portfolio, in both currency and as a percentage. •Double click on a record to see a list of all Portfolios in the system. |
|
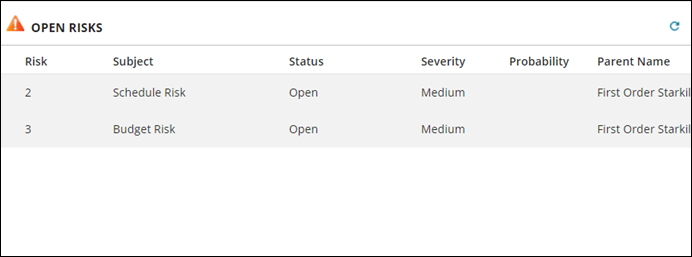
OPEN RISKS •This list view shows each Open Risk along with its current Risk Level, Status, Severity, Probability, Parent Name, Risk Type, and Response. •You can quickly assess both the number and severity of Open Risks and decide if you need to take further action. •Double click on a record to see more detail for each risk. |
|
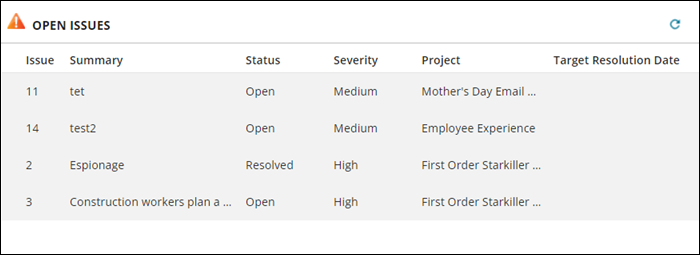
OPEN ISSUES •This list view shows each Open Issues along with its current Status, Severity, Project, and Target Resolution Date. •You can quickly assess both the number and severity of Open Issues and decide if you need to take further action. •Double click on a record to see more detail for each issue. |
|
|
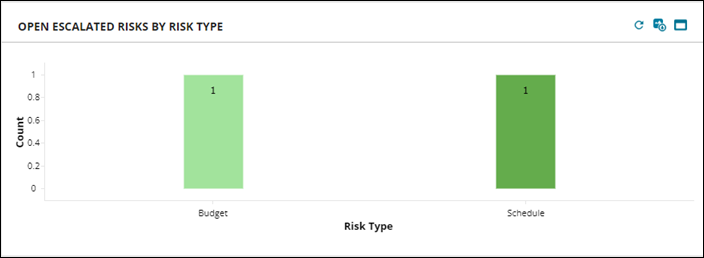
OPEN ESCALATED RISKS BY RISK TYPE •This list view shows each Open Issues along with its current Status, Severity, Project, and Target Resolution Date. •You can quickly assess both the number and severity of Open Issues and decide if you need to take further action. •Double click on a record to see more detail for each issue. |