Global Analytics
To view the performance metrics and usage statistics for your Agentic AI, open the Configuration console and select AI Configuration Hub > Analytics.
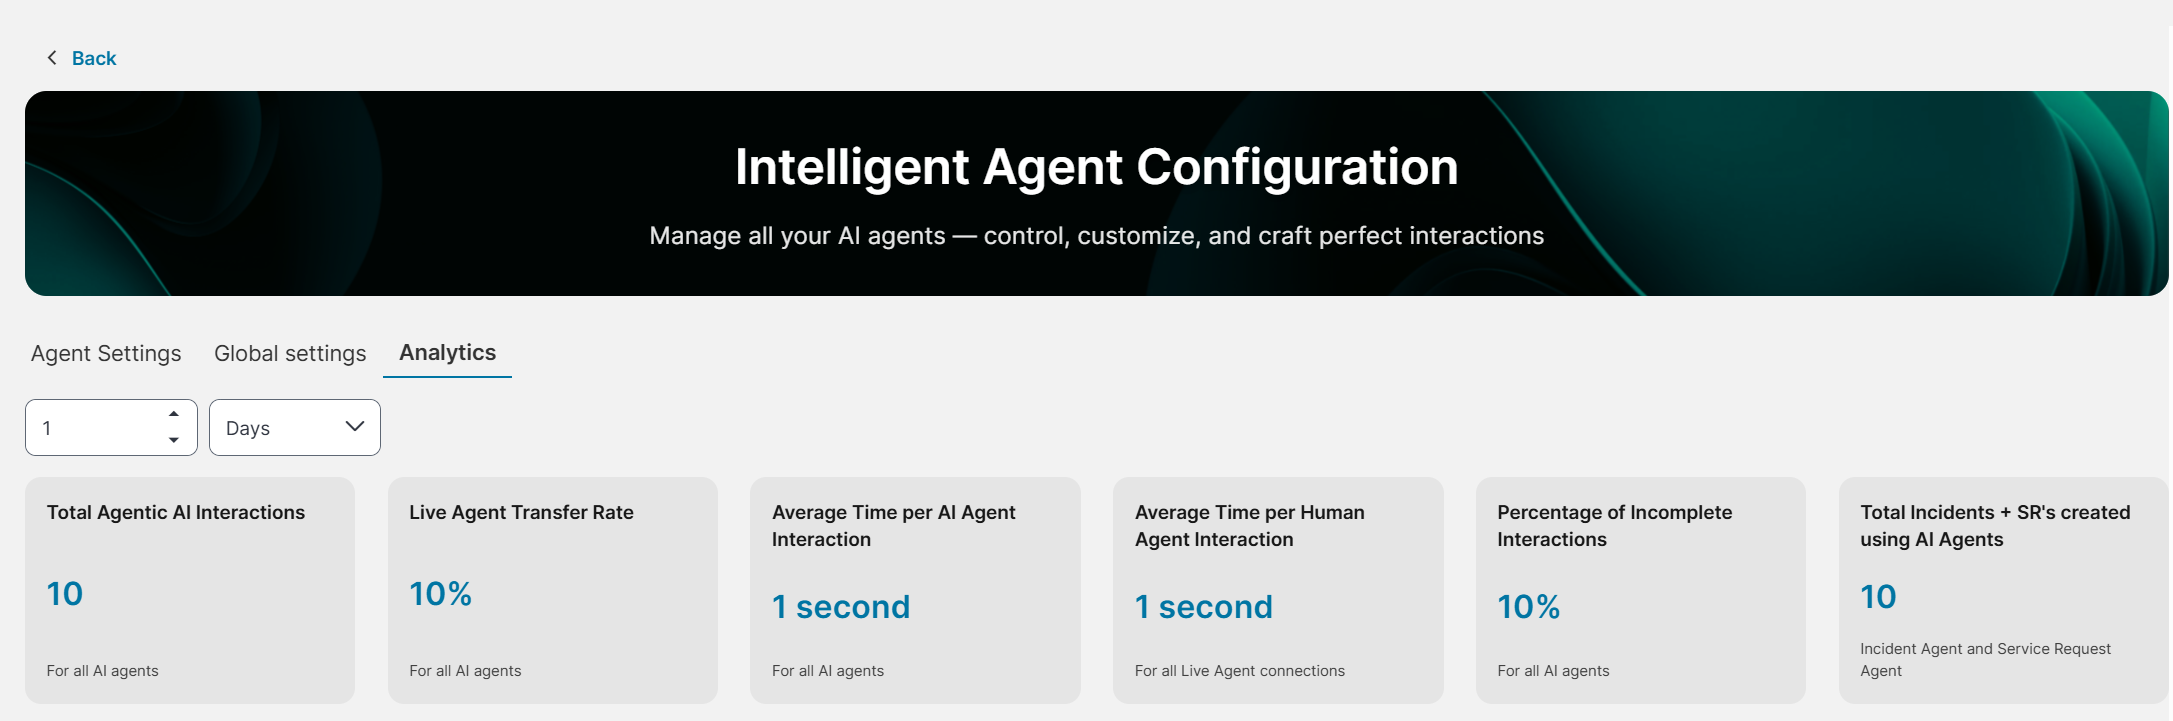
The Analytics page provides a consolidated view of all AI agents’ performance. It helps you monitor the following metrics:
•Total Agentic AI Interactions: Total number of agent interactions.
•Live Agent Transfer Rate: Percentage of interactions that were transferred to Live Agents.
•Average Time per AI Agent Interaction: Average time required for an AI agent to resolve a query.
•Average Time per Human Agent Interaction: Average time required for a human agent to resolve a query.
•Percentage of Incomplete Interactions: Percentage of agent interactions that timed out before completion.
•Total Incidents + SR's created using AI Agents: Total number of Incidents and Service Requests created using AI agents.
The Time Range filter allows users to specify the period for which analytics data is displayed. Metrics on the Analytics page are updated based on the selected time range.
The following image shows the Analytics page.