Dashboard V2
Role: Administrator.
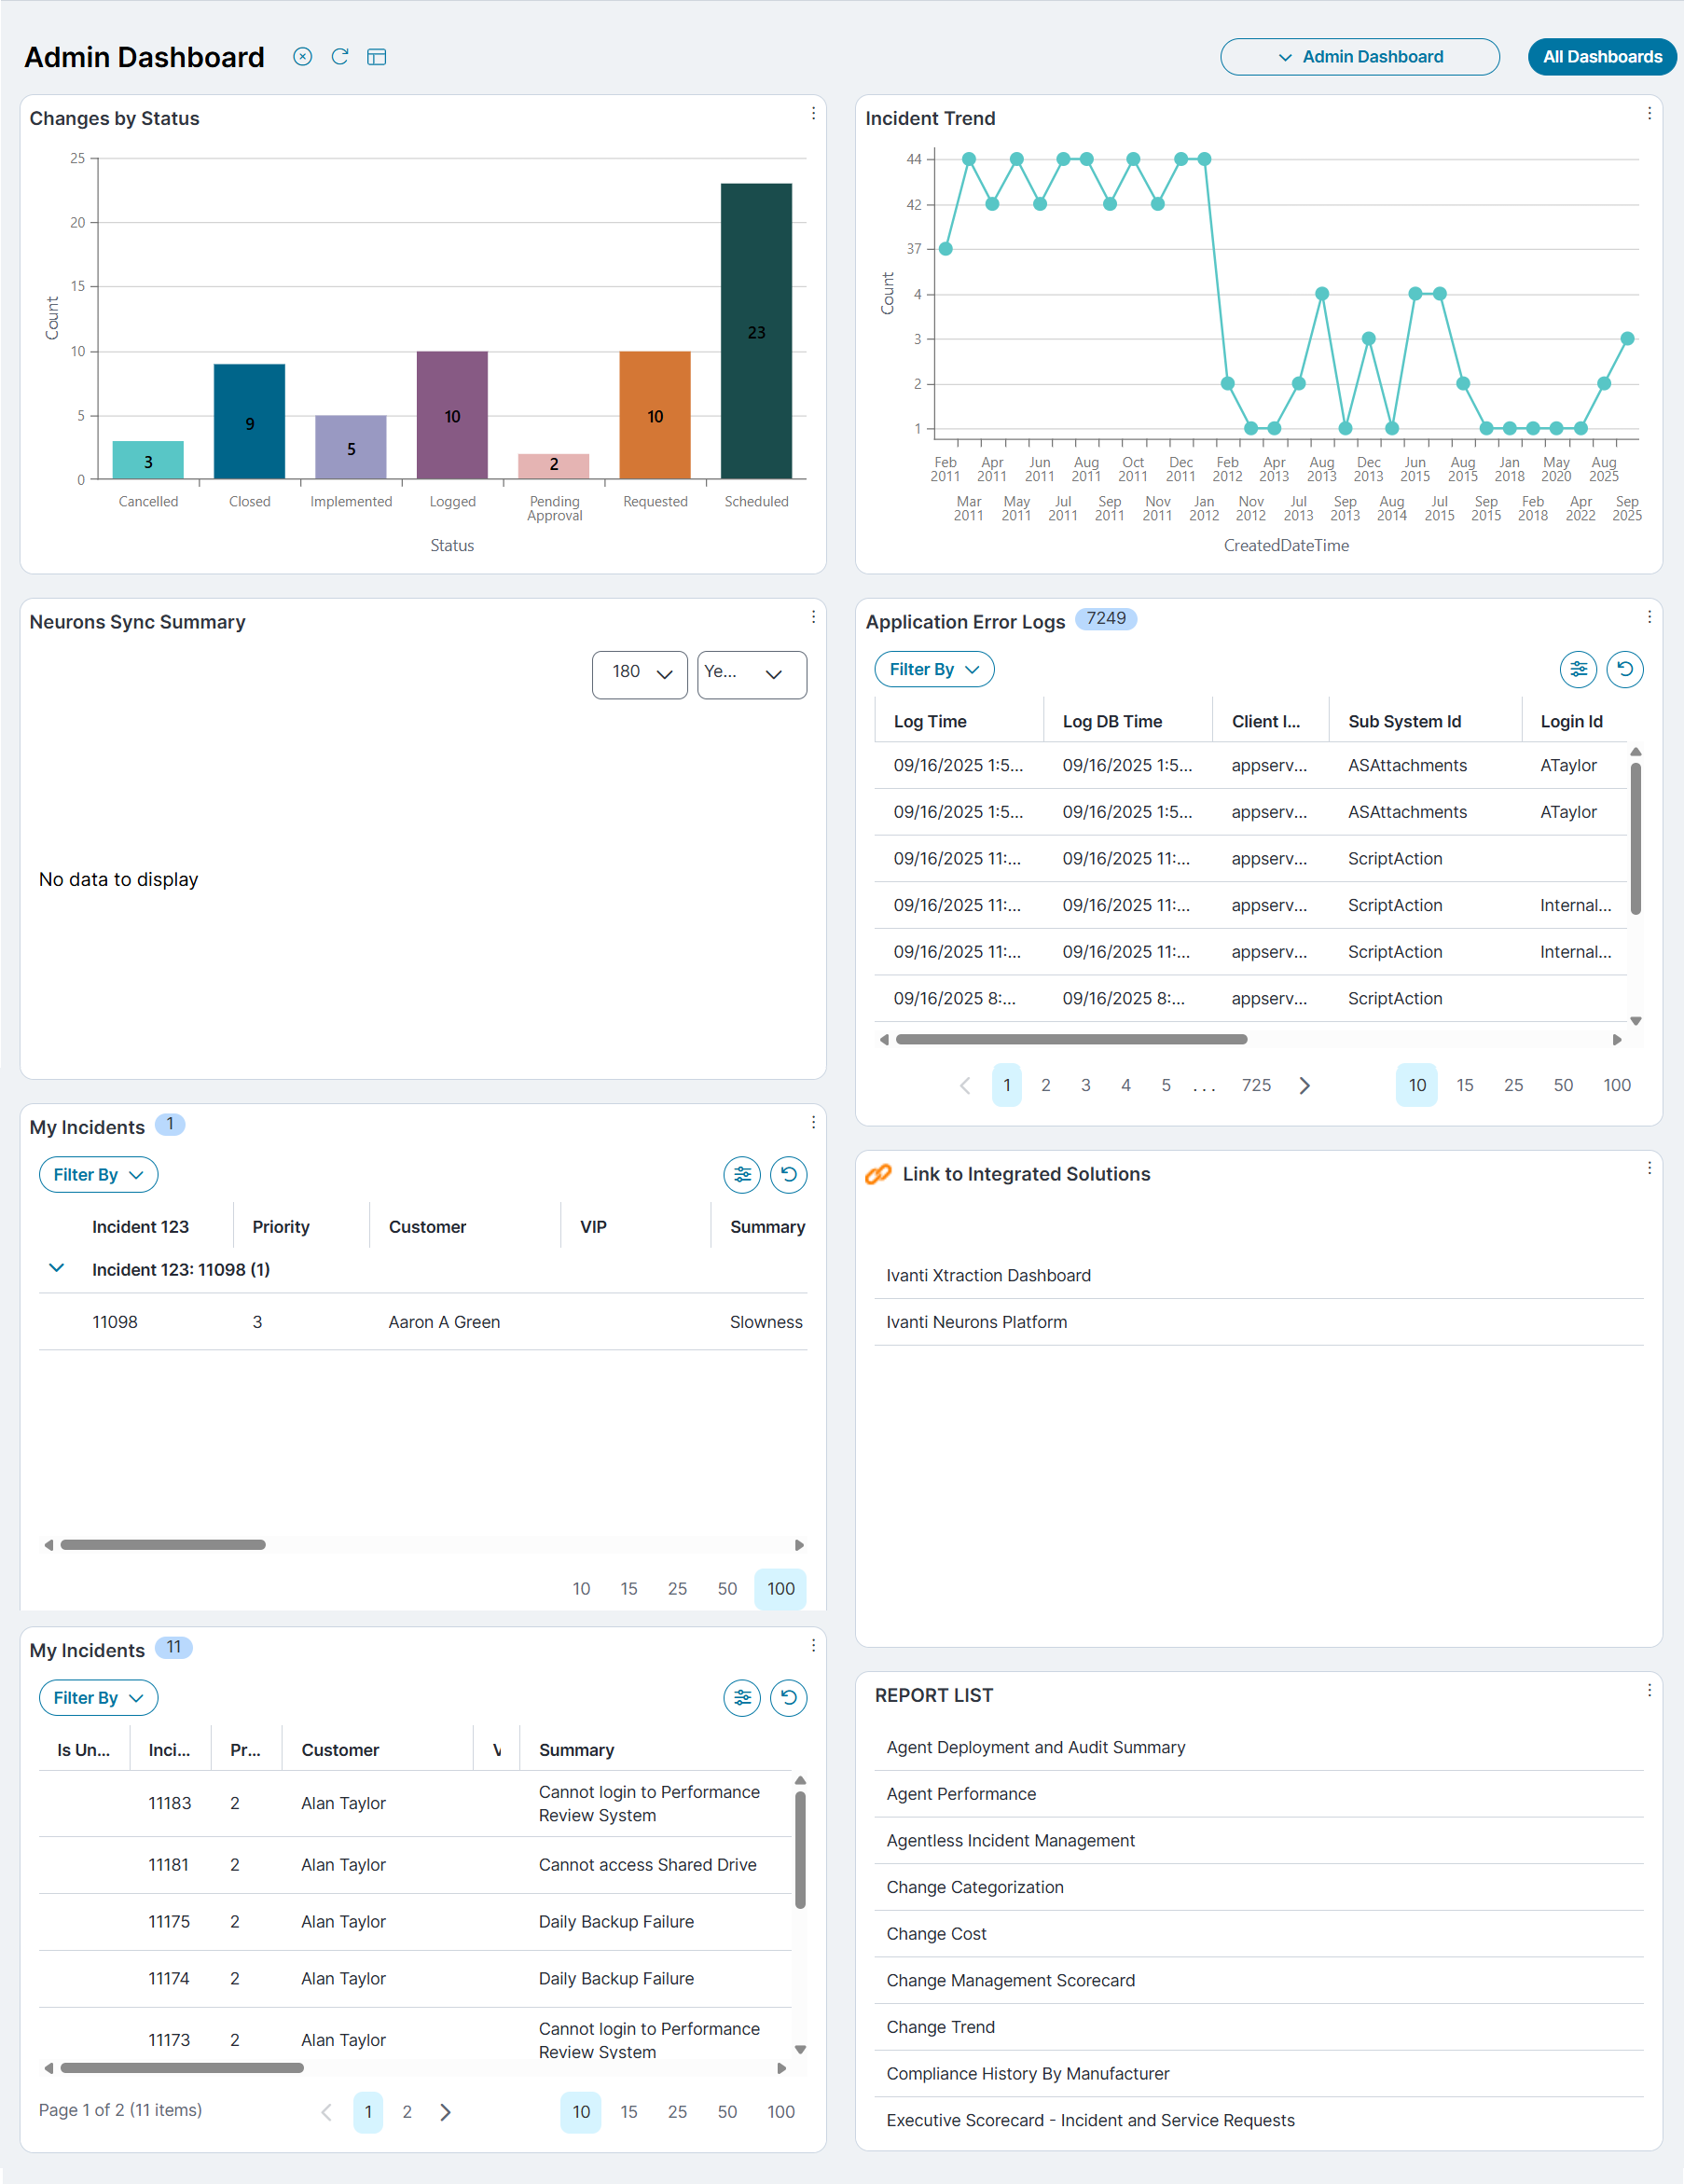
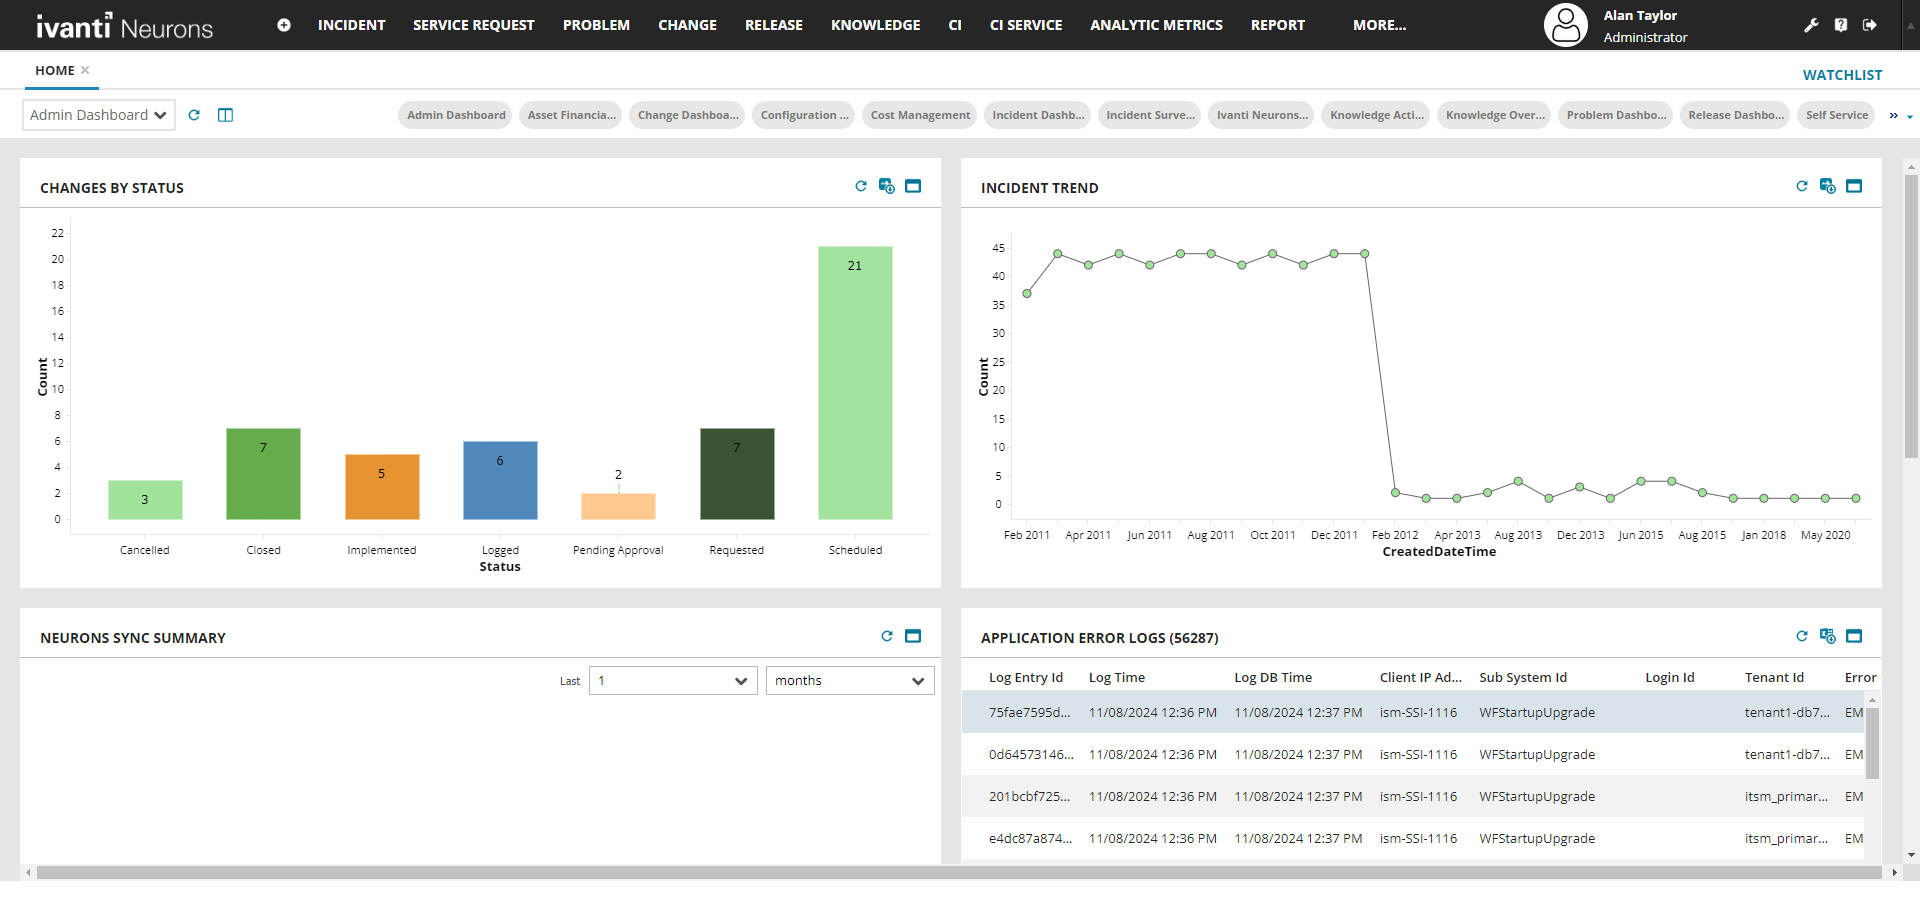
Dashboard V2 is an improved dashboard with a modern UI, available by default to all customers. It includes all the functionality of the legacy dashboard with a visually appealing interface. If an incident or business object description contains custom HTML, it also renders in Dashboard V2.
Enable Dashboard V2 for legacy users
Adding the Dashboard V2 to a role:
1.Log in to Neurons for ITSM as an Administrator.
2.In the Configuration console, select Users and Permissions > Roles and Permissions, then select the Admin role.
3.Select Top Level Tabs > Home.
4. In the Top Level Tabs window, locate the Home entry, and then click the red cross ![]() at the far right of the entry to delete the tab.
at the far right of the entry to delete the tab.
If the Dashboard workspace is not configured as your Home tab, then select the tab that is set as Dashboard.
5.Select Add New Tab > Dashboard V2.
6.Change the Name field to Home.
7.Select the The Tab Is Initially Visible checkbox.
This displays the Dashboards on the Home page.
8.Click Save.
This will change your legacy dashboard view to the new Dashboard V2.
Revert to Legacy Dashboard
1.Log in to Neurons for ITSM as an Administrator.
2.In the Configuration console, select Users and Permissions > Roles and Permissions, then select the role for which you need to revert from Dashboard V2 to legacy Dashboard.
3.Click Top Level Tabs > Delete This Tab > Yes to delete the tab.
4.Click Add New Tab > Dashboard as tab, and configure the tab details with new Name, Hidden Expressions, and Search Tags; then select Add This Tab.
5.Click Save.
This reverts the dashboard to the legacy view.
Working with Dashboard V2
Toolbar Options
In Dashboard V2, you can:
•Click refresh  icon to manually update all widgets, including charts, tiles, and tables.
•Click  icon to auto refresh to enable or pause automatic data refresh based on the configured interval (5 to 60 minutes).
•Click  icon then drag the borders of dashboard components to resize them for better visibility.
Configuring Dashboard Chart Colors
In Neurons for ITSM, Administrator can configure Dashboard Chart Colors for both Pick List and non‑Pick List fields. This helps ensure that data is presented clearly and consistently across dashboards. Because the setup varies depending on the type of field, the following steps outline how to configure chart colors in each case. The Dashboard Chart Colors can be configured in Dashboard V2.
This feature is supported for all chart type except pivot table charts.
For Pick List fields:
To configure Dashboard Chart Colors, perform the following:
1.Log in to Neurons for ITSM as an Administrator.
2.Click Configuration Application  icon.
icon.
3.From the Configuration console, click Build > Business Objects.
The list of Business Objects is displyed.
4.Select any Business Object > Fields.
The list of fields is displayed.
5.Select the field for which you want to configure the Dashboard Chart Colors.
The field details are displayed.
6.Under the field details, go to Pick List and note the Pick List Name.
7.From the Configuration console, click Build > Pick Lists.
The list of Pick Lists is displayed.
8.Find the noted Pick List Name and click values.
The values details are displayed.
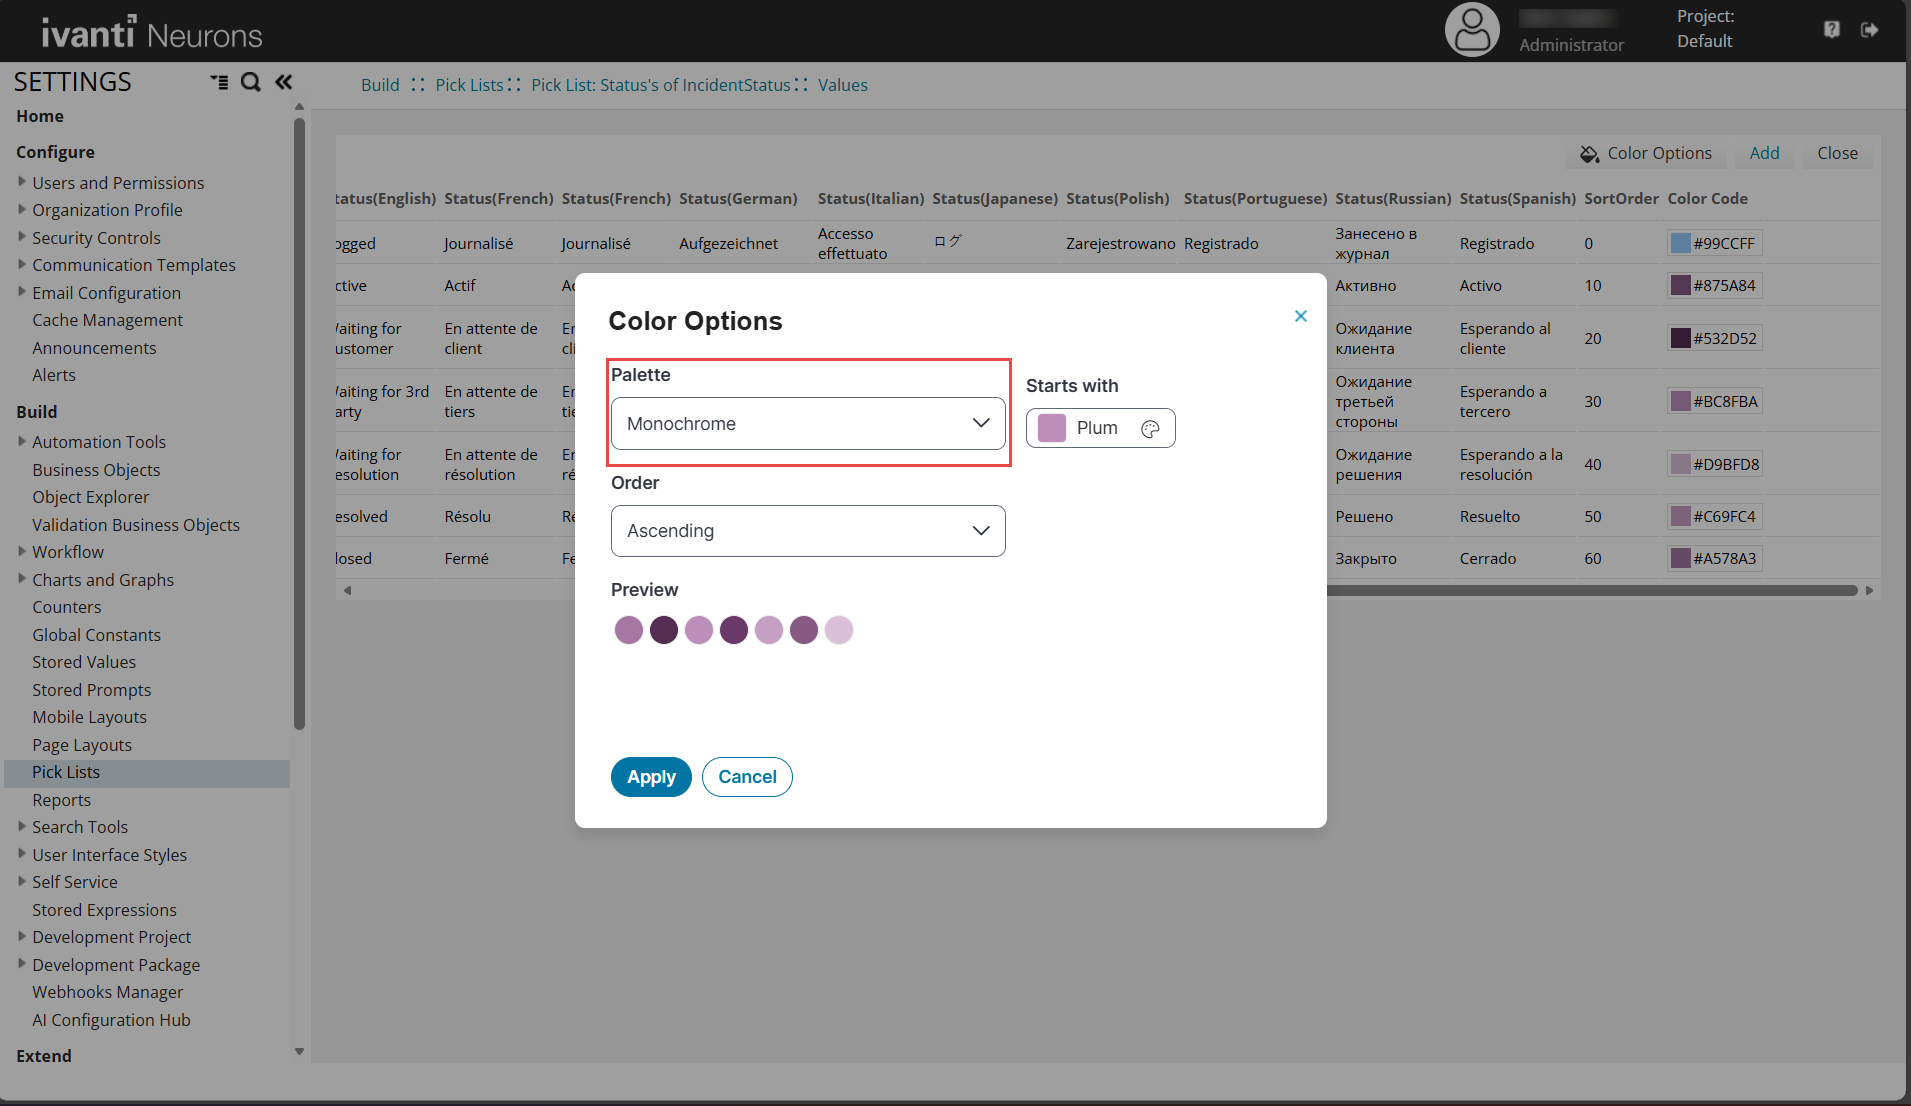
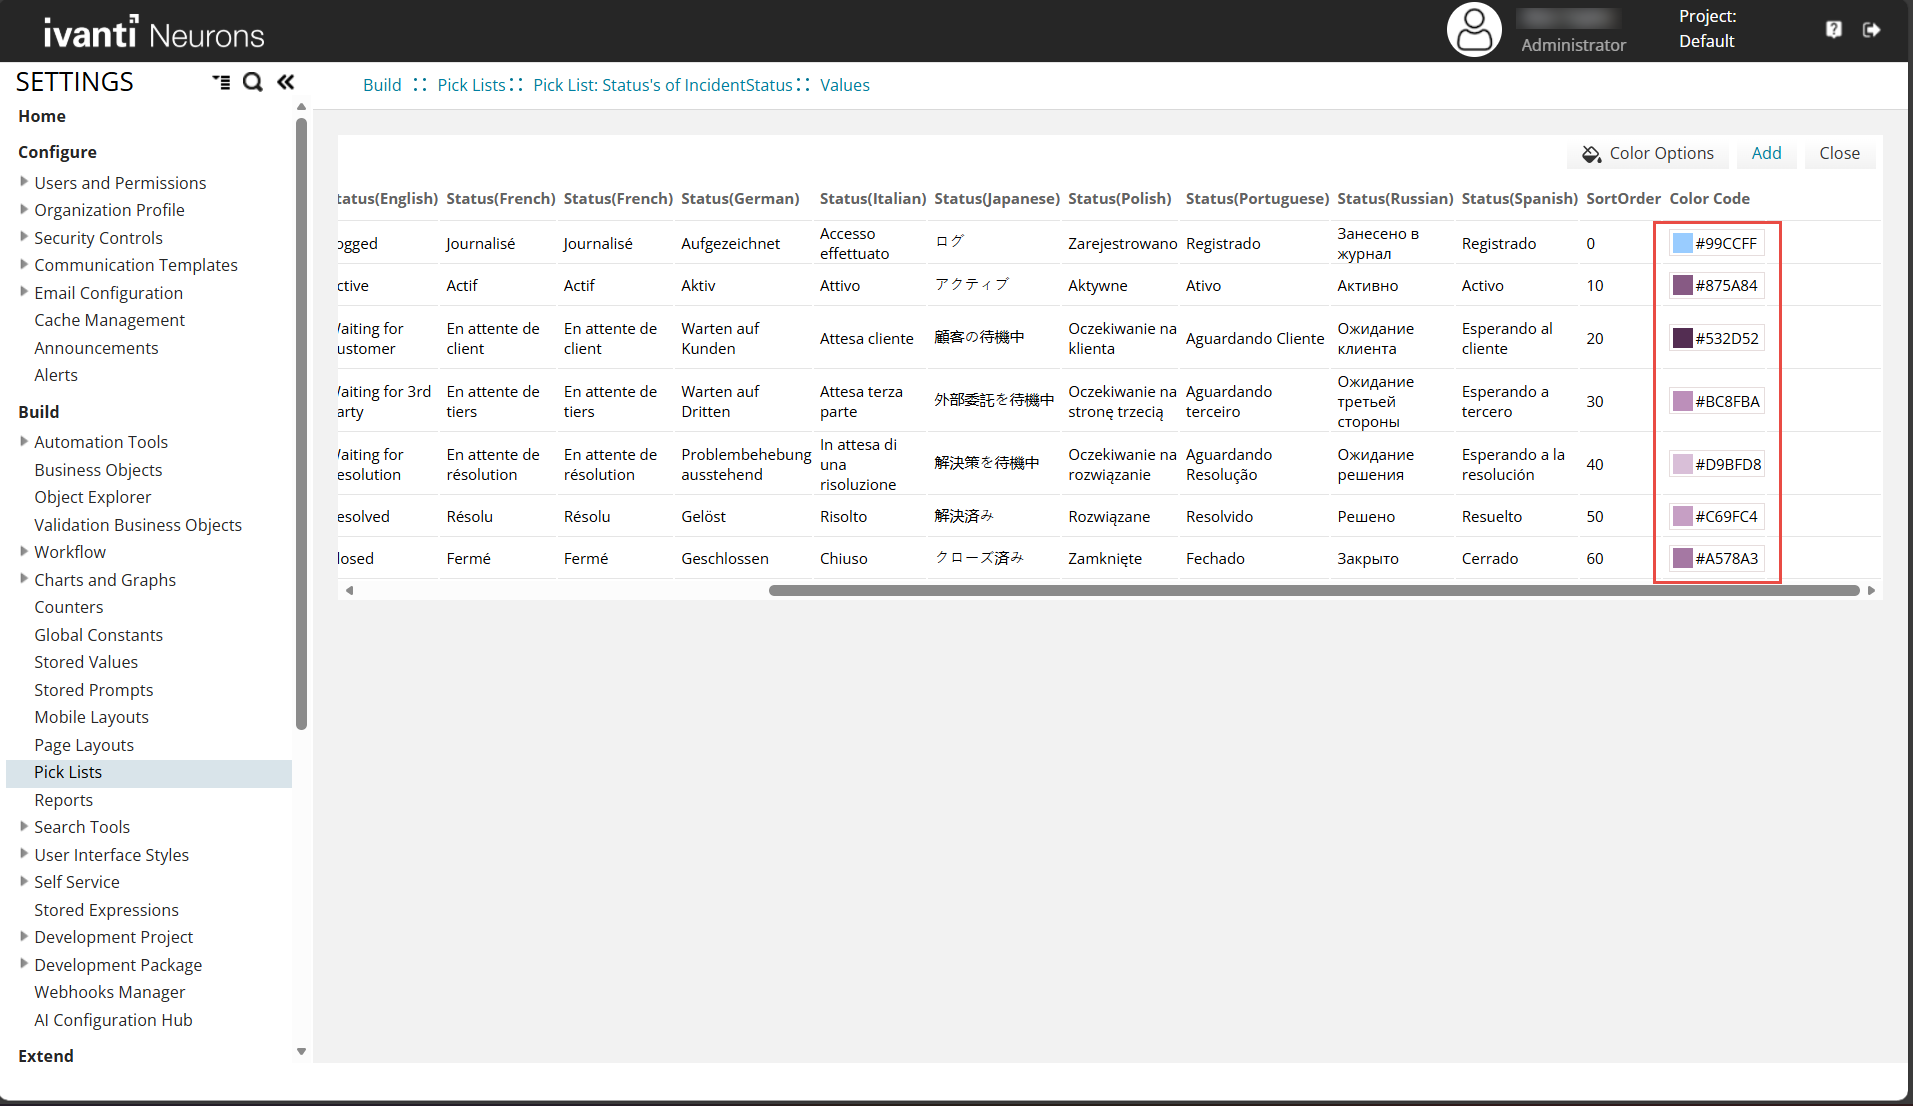
9.Click Color Options under Palette, use the dropdown to select the color palette and other advanced options. Click Apply to save the changes.
Color palette for Pick List fields
10.Alternatively, under Color Code, you can change the color by selecting a specific color code.
The configured colors in the Pick List will appear in the charts.
Color code for Pick List fields
For non-Pick List fields:
To configure Dashboard Chart Colors, perform the following:
1.Log in to Neurons for ITSM as an Administrator.
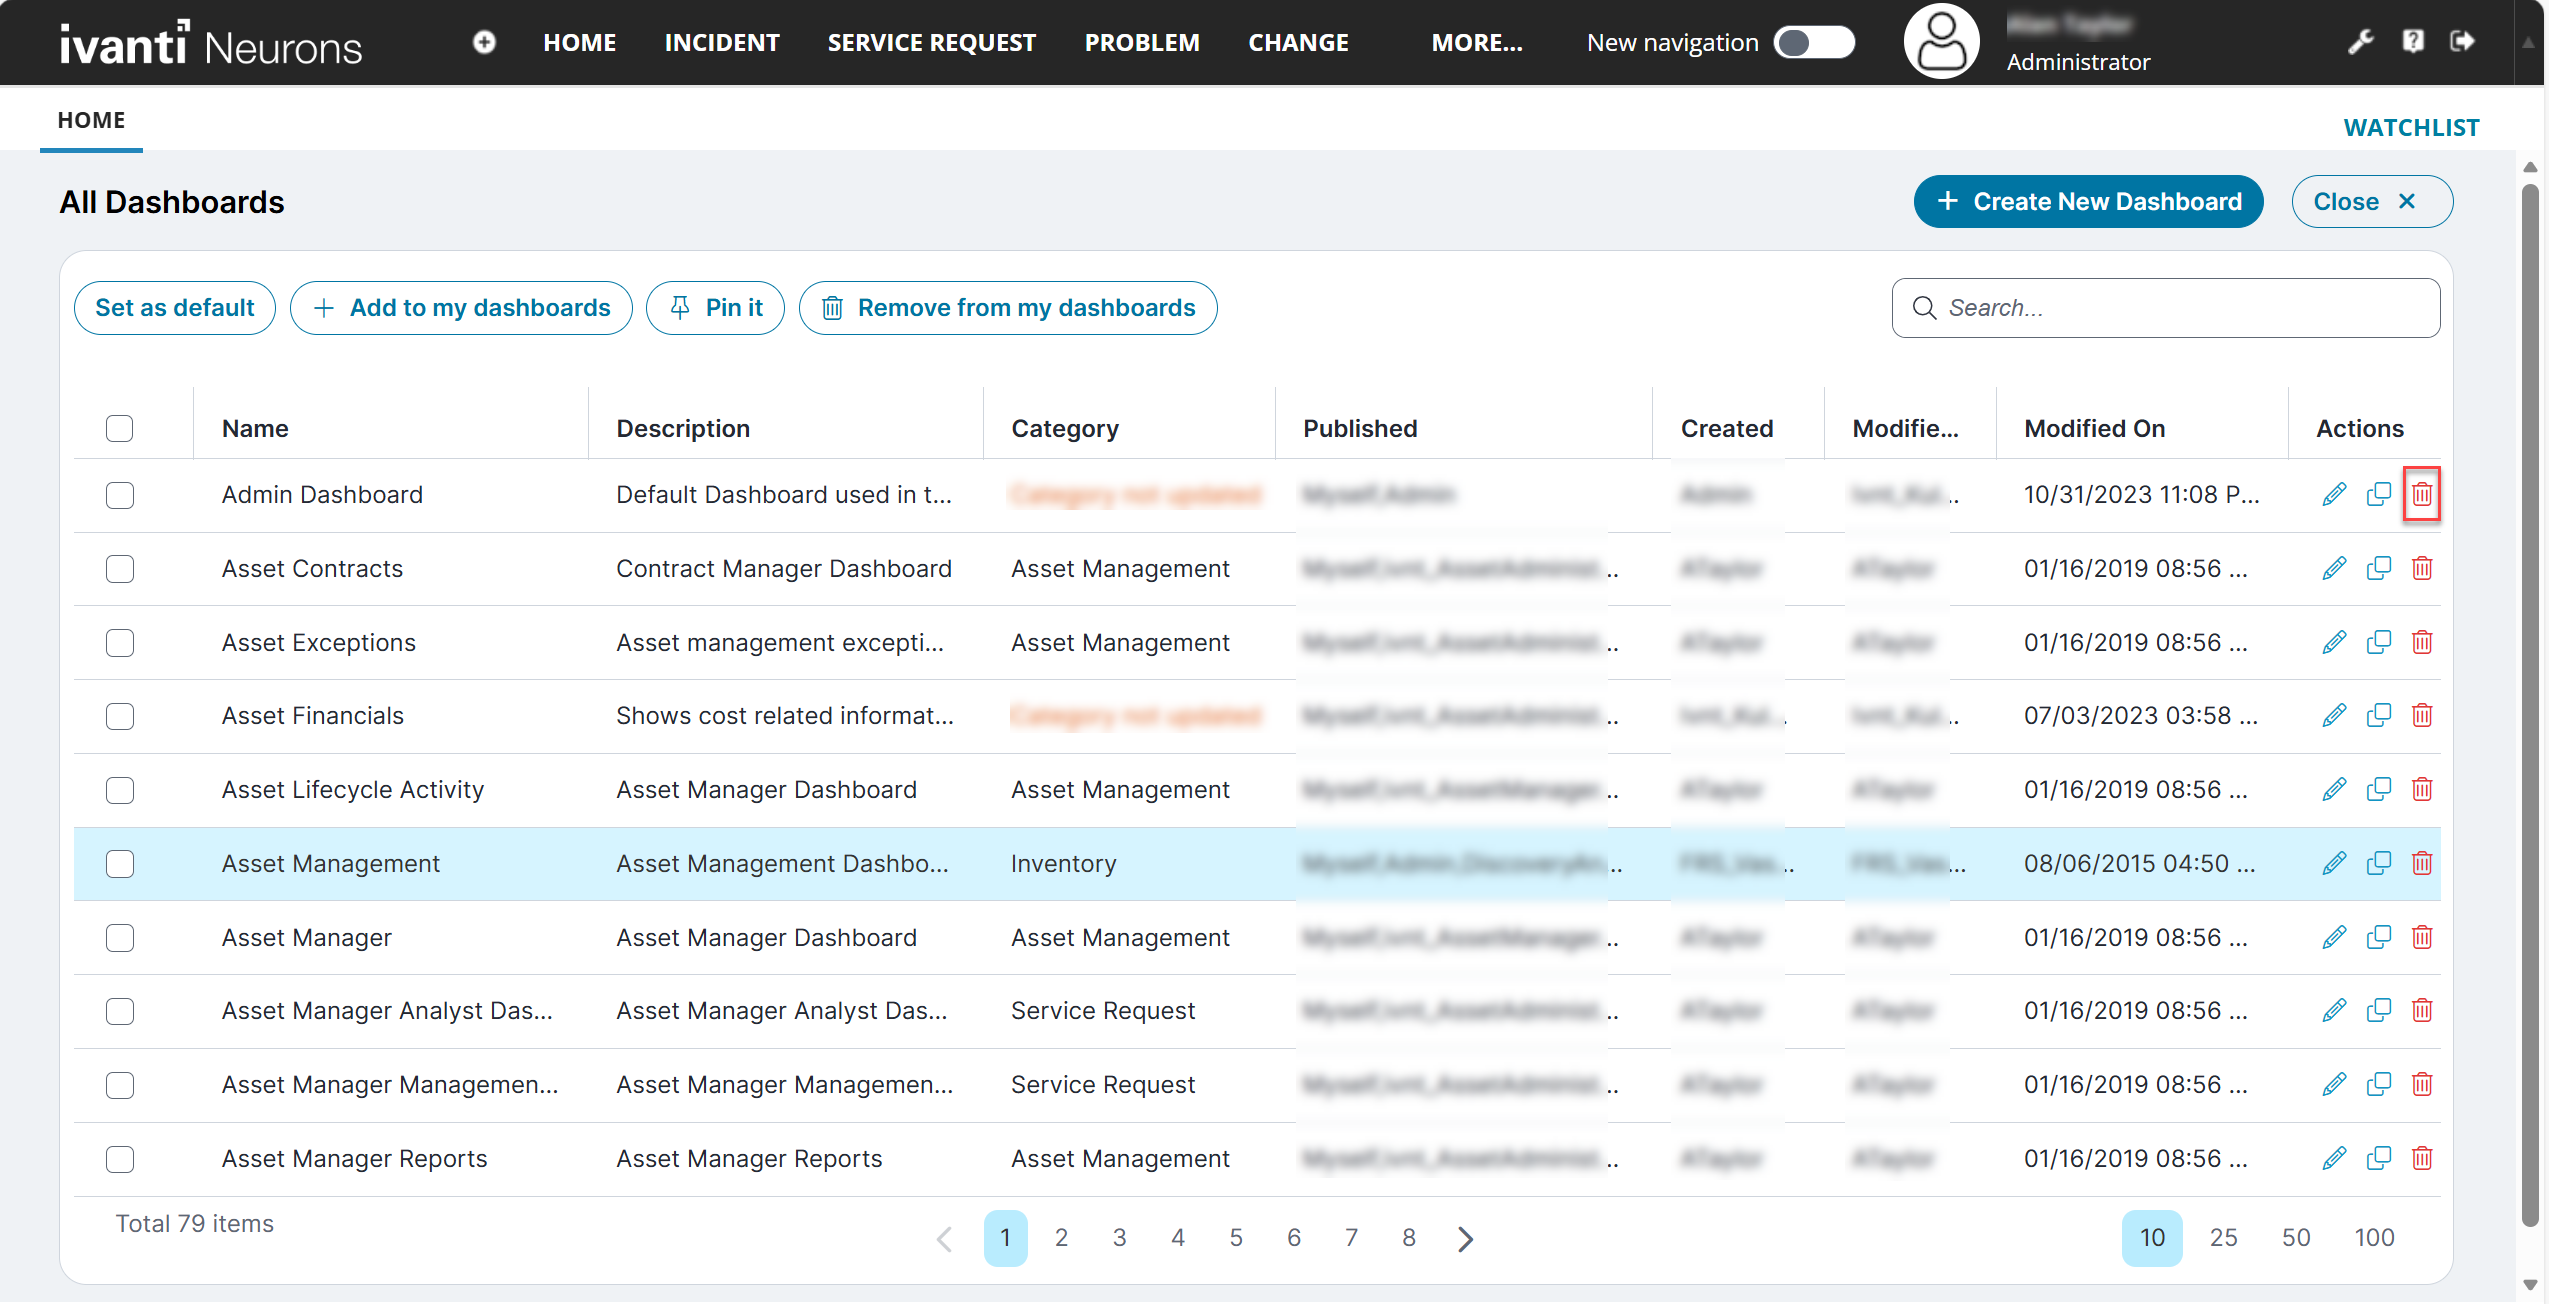
2.From the Home workspace, click All Dashboards.
The list of all available Dashboards is displayed.
3.Find the Dashboard entry you want to configure the Chart Colors, and then click the Edit ![]() icon under the Actions column.
icon under the Actions column.
The Dashboard you selected opens in edit mode.
4.Click the Options ![]() icon > Edit icon for the chart you want to configure the Chart Colors.
icon > Edit icon for the chart you want to configure the Chart Colors.
The Chart Wizard workspace is displayed.
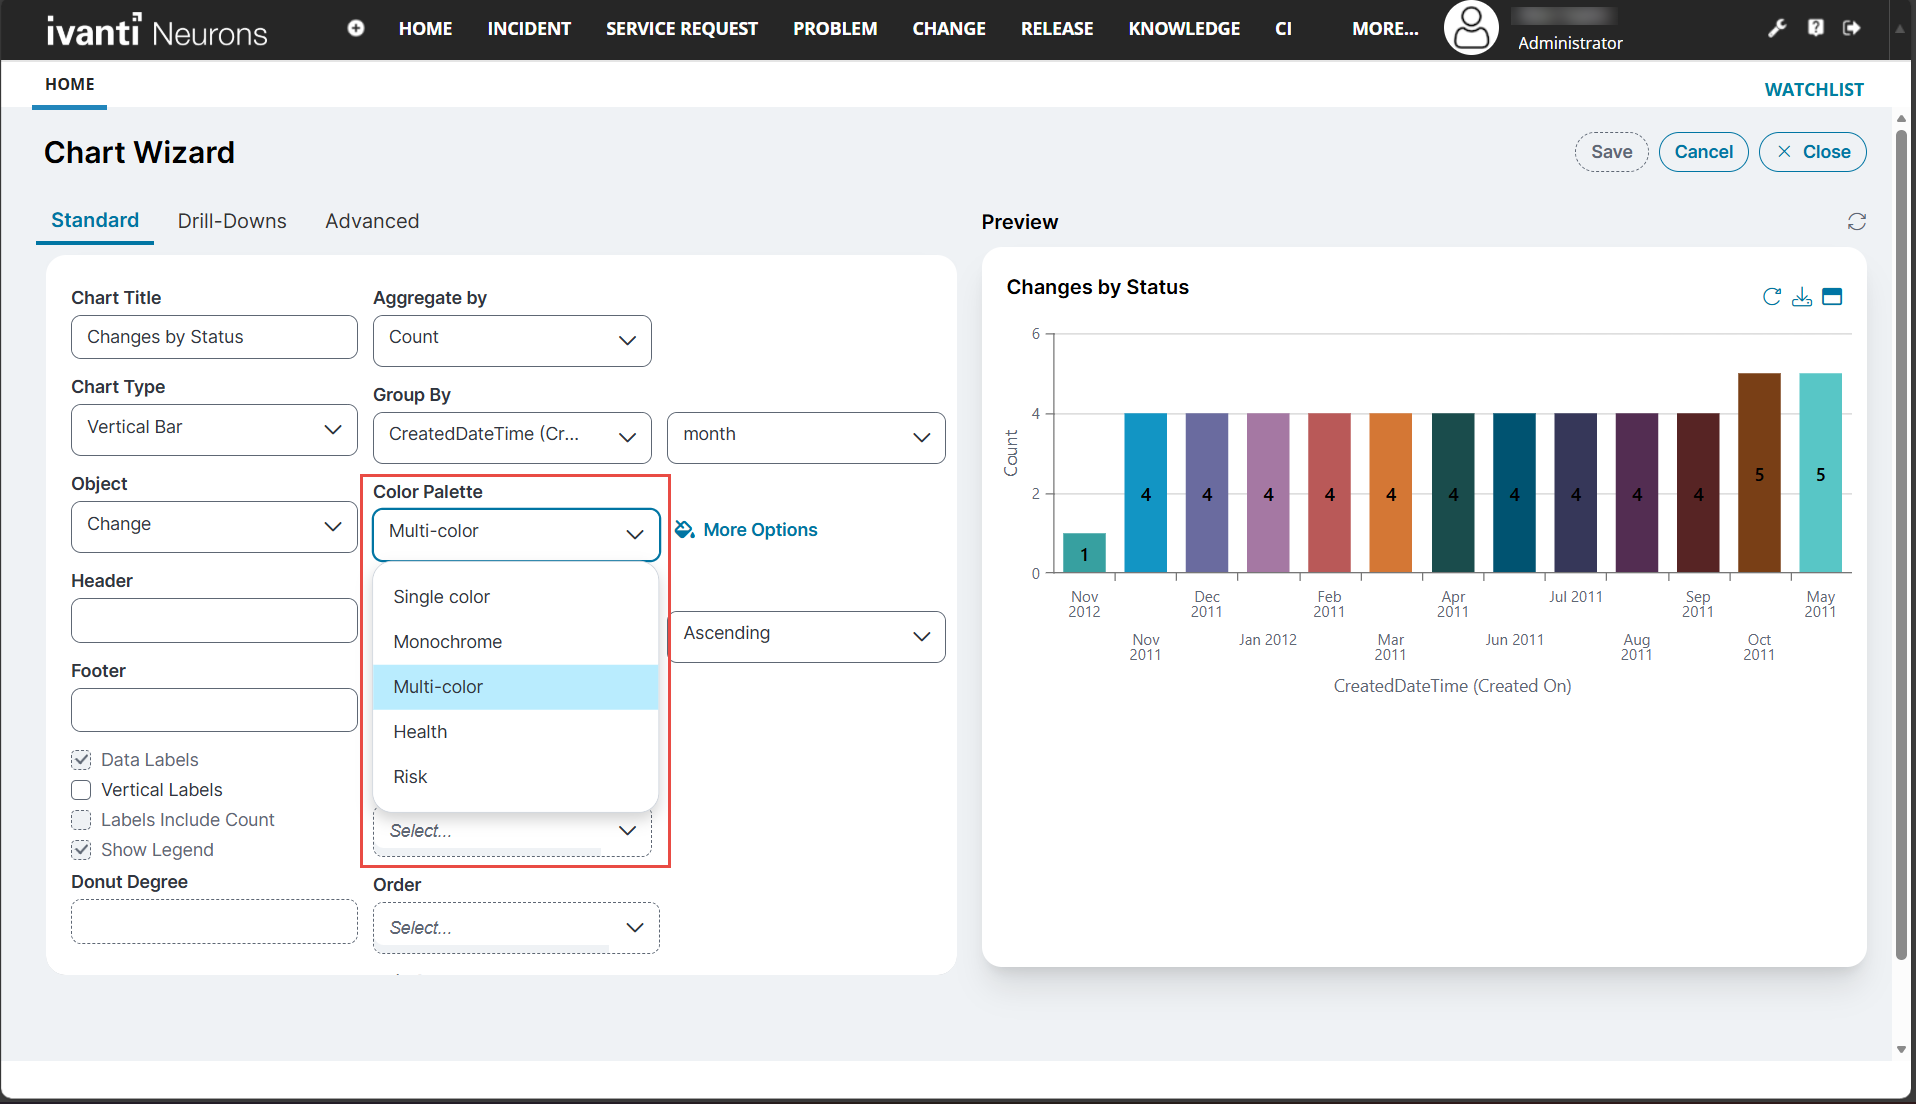
5.Under Standard, use the drop-down list to select a non-Pick List field under Group By.
6.Under Color Palette, use the drop-down list to select the color palette.
7.Alternatively, click More Options under Palette, use the dropdown to select the color palette and other advanced options. Click Apply.
8.Click Save to save the changes.
Color palette for non-Pick List fields
Copying a Dashboard URL
Share a dashboard by sending its URL through, for example, Microsoft Teams or email.
1.Log in to Neurons for ITSM.
2.On the Dashboard page, click  Copy Dashboard URL.
The system copies the dashboard link to your clipboard.
3.To copy the URL of a different dashboard:
| a. | Select All Dashboards, locate the dashboard you want. |
| b. | Click Copy Dashboard URL for that dashboard. |
The system displays a confirmation message.
Copy Dashboard URL
Customize Chart Axis Labels
Customize the X and Y axis labels displayed in chart based widgets. This configuration applies to all chart types that display axes, including vertical bar, horizontal bar, and line charts.
Customize X and Y Axis Labels
1.Log in to Neurons for ITSM.
2.Click All Dashboard.
3.Click the Edit icon.
icon.
4.From the Options  Widget, Click Edit .
5.Locate the X axis Label and Y axis Label fields.
6.The system populates these labels based on the selected data fields:
| a. | Group By determines the X axis label. |
| b. | Aggregate By determines the Y axis label. |
7.Update each label as required.
The widget updates the axis labels immediately.
Example: If Group By = Status, the X axis label displays Status by default.
If Aggregate By = Count, the Y axis label displays Count or Number of Incidents.
You can overwrite these defaults by entering custom labels i.e., Incident Status and Incident Count.
Translate Axis Labels
Translate axis labels into any language supported by ITSM.
1.In the widget editor, open the Translate option.
2.Select the Source Language (for example, English).
3.Select the Target Language from the list of supported languages.
4.Enter the translated label text.
5.Click Yes to save.
The translation applies to all supported chart types.
Pure table widgets and funnel charts do not use X or Y axes. Axis customization options do not appear for these Widgets.
Customize Pie Chart Legends
Pie charts do not include axes but support legend label customization.
1.Open the widget and click Edit.
2.Locate the Legend Title field.
3.Enter the desired label, such as Incident Status.
The widget updates the legend label immediately.
Tiles
Tiles in the Dashboard V2 workspace gives a snapshot of the user's work. For example, you can create custom tiles to display the number of open incidents, high-priority incidents, security incidents, and more, to get a quick overview.
1.Log in to Neurons for ITSM as an Administrator.
2.From the Home workspace, click All Dashboards.
The list of all available Dashboards is displayed.
3.Locate the Dashboard entry you want to edit, and then click the Edit ![]() icon under the Actions column.
icon under the Actions column.
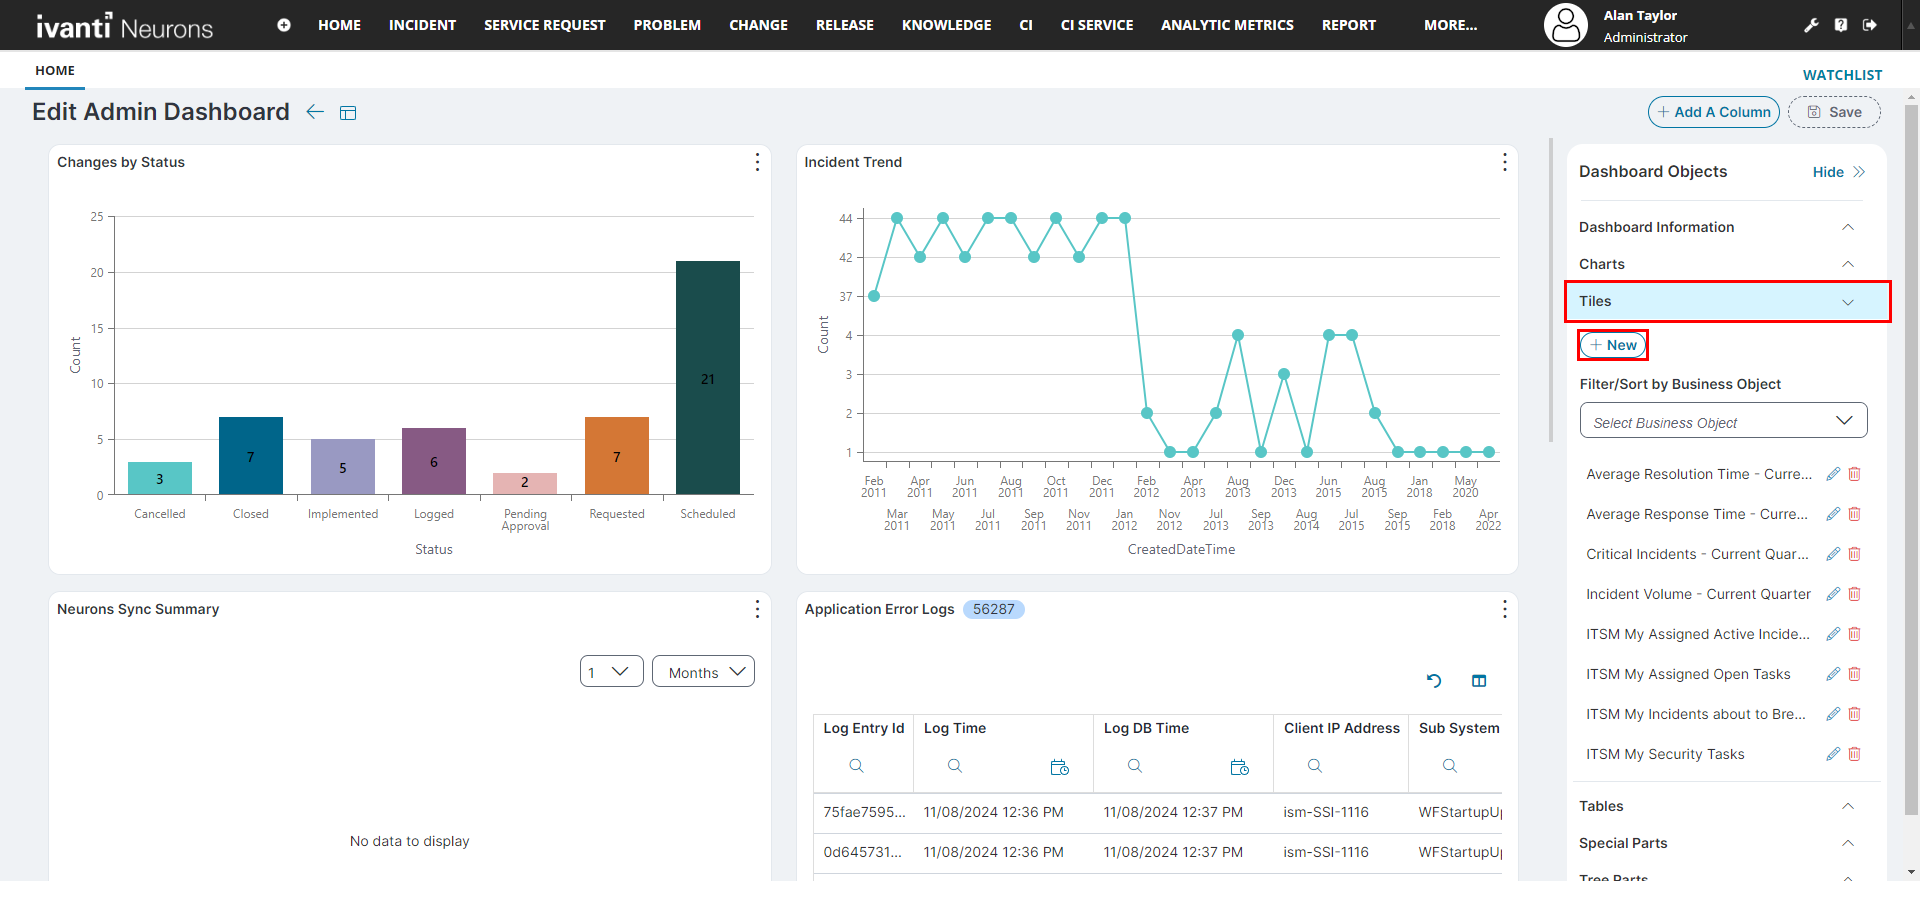
The Dashboard you selected opens in edit mode.
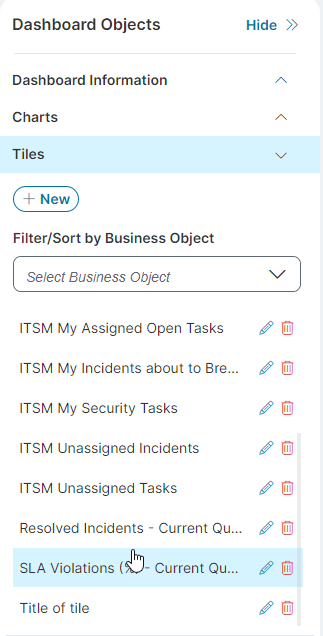
4.From the right-side panel, select the Tiles dropdown, and then click New.
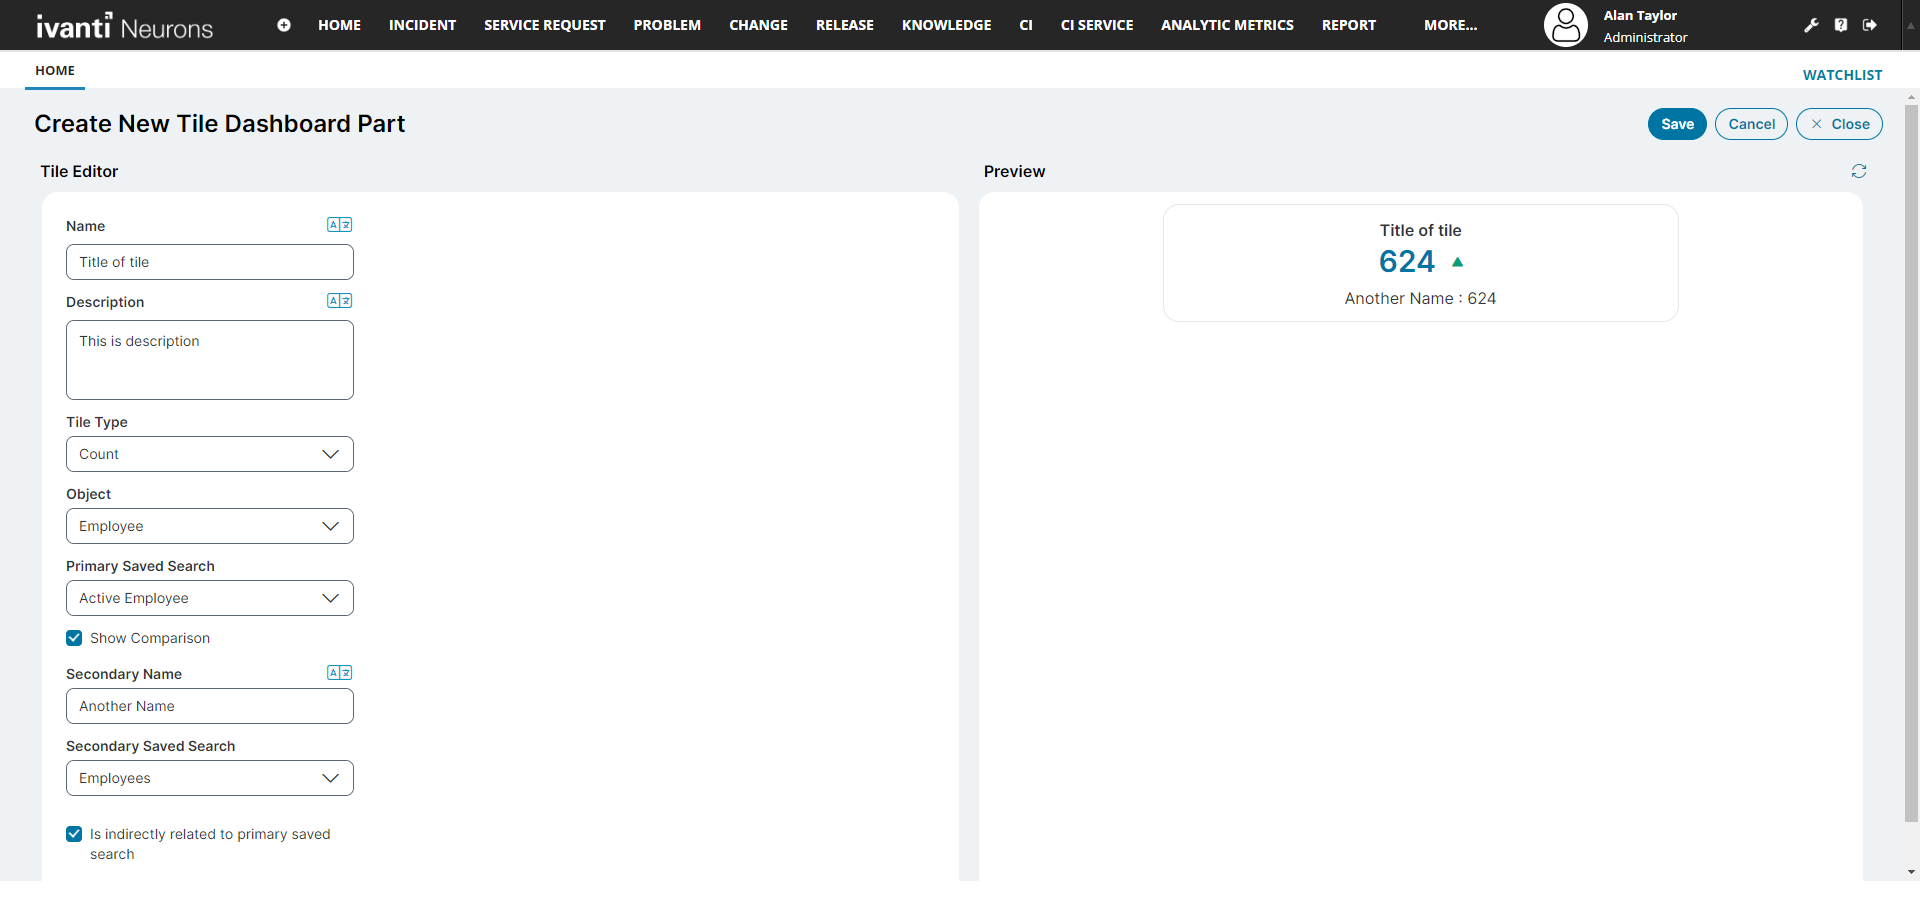
The Tile Editor opens.
5.Enter the following information in the Tile Editor page:
•Name - Enter a contextual name.
•Description - Enter a relevant description.
•Tile Type - Select one of the following option:
•Count - Displays data as a number (example number of open incidents).
• Percentage -Displays data as a percentage, for example percentage of closed incidents in a quarter.
•Sum - Displays total sums, for example, total time spent resolving incidents.
•Average -Displays average values. It can be used to display the average time spent on each incident resolution. For example, If the total time spent on resolving 10 incidents were 85 minutes, then average time spent on each incident is 8 minutes and 30 seconds.
•Object -Select the Business Object on which the tile data is based. For example, Incident, Change.
•Select Field from Relationship - (Optional) select this checkbox if you are using data in the tile from a related Business Object field of the main Business Objects.
For example, if you want to display the Total Resolution Time, you need to select this checkbox as the data can be fetched from the Incident's related Business Object - Escalation Watch.
•Relationship - Displayed only if the Select Field from Relationship checkbox is selected. Select the related Business Object. Example, Escalation Watch Via Incident Association.
•Field - Select the field of the Business Object from which data is pulled into the tile. Example, TotalRunningDurationInHours.
•Unit of Field - Enter the unit of the field. Example, enter Hours if the data represents time, enter $ if the data represents price.
•Primary Saved Search - This is the first input for the tile. Select a Saved Search, for example, All Active incident or All Open Incidents.
•Show Comparison - Select the checkbox if you want to compare two inputs.
•Secondary Name - Enter a contextual name for the secondary input.
•Secondary Saved Search - Enabled only if the Show Comparison is selected. This is the second input for the tile. Select a Saved Search, for example, All Resolved Incidents or All Closed Incidents.
•Is indirectly related to the primary saved search - Select the checkbox when the Primary Saved Search data is greater than the Secondary Saved Search data and you want it to be displayed as a positive number.
6.Click Save.
The tile get listed in the Tile dropdown in the right-side panel in edit mode of Dashboard.
1.Log in to Neurons for ITSM as an Administrator.
2.From the Home workspace, click All Dashboards.
The list of all available Dashboards is displayed.
3.Locate the Dashboard entry you want to edit, and then click the Edit ![]() icon under the Actions column.
icon under the Actions column.
The Dashboard you selected opens in edit mode.
You can also drag tiles in the Edit mode to create your customized view of a Dashboard.
4.From the right-side panel, select the Tiles dropdown.
5.Select and drag the desired tile into the dashboard.
6.Click Save.
The tile is added to the dashboard at the dragged position.
1.Log in to Neurons for ITSM as an Administrator.
2.From the Home workspace, click All Dashboards.
The list of all available Dashboards is displayed.
3.Locate the Dashboard entry you want to edit, and then click the Edit ![]() icon under the Actions column.
icon under the Actions column.
The Dashboard you selected opens in edit mode.
4.From the Dashboard, click the icon with the vertical ellipsis  on the top-right of the tile you want to remove.
5.Click Remove and click Save.
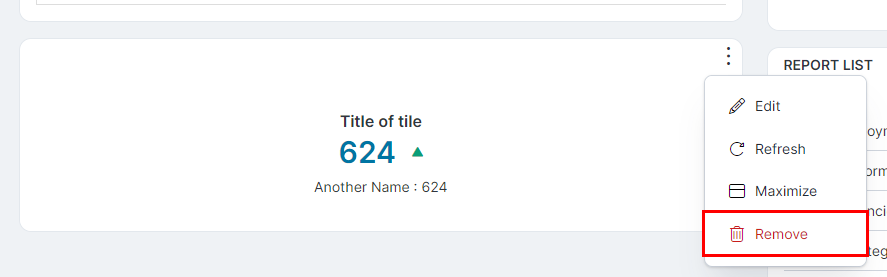
This will remove the tile from the Dashboard view.
You can clone a dashboard from an existing one to save time and effort.
Following are the steps to clone a dashboard.
-
From the Home page, click All Dashboards. The list of all available Dashboards is displayed.
-
Locate the Dashboard you want to clone, and click the Clone icon
 under the Actions column.
The Clone Dashboard window will appear.
-
Edit the name of the existing dashboard. Click Yes.
A success message is displayed and the cloned Dashboard is added to the list, retaining all properties of the original.
You can use Global Dashboard Filters to apply a single filter across all applicable widgets in a dashboard. Once you configure this filter, it applies consistent data filtering across all supported widgets, enhancing both dashboard interactivity and data consistency.
Configuring a Global Dashboard Filters
To configure the Global Dashboard filter, follow these steps:
1.Log in to Neurons for ITSM.
2.Navigate to Dashboards > All Dashboards.
3.Select the desired dashboard from the list.
4.Click Edit to enter the dashboard configuration mode.
5.Select the Global Filter configuration option.
6.Choose a supported field (validated by a pick list) that is common across all business objects represented in the dashboard.
7.Define the filter criteria (e.g., Status = Active).
8.Save the dashboard.
Example: If you have widgets such as "My Team - Active Incidents by Owner" and "Changes by Status" in your dashboard, applying a global filter on Status = Active will reflect across both widgets.
To view data, you must select at least one value in the Global Filter drop down. If no value is selected, the system displays the message: "Please select at least one field value to display data."
Global Filters Access and Permission Guidelines
The following access and permission guidelines are required for users to use global filters on dashboards:
•Edit Dashboard access is required to configure Global Filters.
•View Dashboard access is required to access and view global filters on the dashboard.
•User role with Edit Dashboard rights can configure global filters.
•View Dashboard rights are required to see the global filter and its effect on the dashboard.
•Global filters apply only to Charts, Pivot Tables, and Tables; they do not apply to other widget types.
•The Global Filter dropdown displays only fields that are common across all widgets on the dashboard.
•The Global Filter dropdown supports the following field types:
•Picklist validated fields
•Boolean fields
•DateTime fields
Following are the examples or the use cases of different tiles that you can create:
To create a tile that displays the real time counts or data with Active Changes and Approvals, enter the following information in the tile editor with:
1.Name - Active Change
2.Description - All active changes
3.Tile Type - Count
4.Object - Change
5.Primary Saved Search - Active Changes
6.ShowComparison - select the checkbox
If you do not select this checkbox, you cannot input the secondary data, and therefore you cannot compare data.
7.Secondary Name - Pending Approval
8.Secondary Saved Search - Changes Pending Approval
9.Is indirectly related to the primary saved search checkbox - do not select
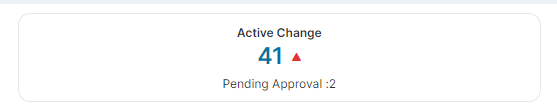
The primary input data is flagged in red indicating it as a warning as shown in the image below.
Tile Preview - Primary input data flagged red
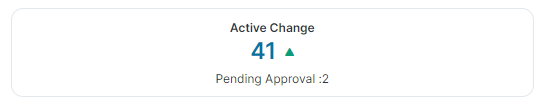
10. Is indirectly related to the primary saved search checkbox - select
The primary input data is flagged green indicating it is a positive sign as shown in the image below.
Tile Preview - Primary input data flagged green
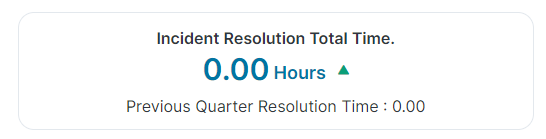
To create a tile that displays the real time data with Sum and Average Incident Resolution Time, enter the following information in the tile editor with:
1.Name - Incident Resolution Total Time.
2.Description - Total Time taken to resolve/close incidents.
3.Tile Type - Sum.
4.Object - Incident.
5.Select Field from Relationship - select the checkbox.
6.Relationship - select the related Business Object - Escalation Watch Via Incident Association.
7.Field - select the TotalRunningDurationInHours field.
8.Unit of Field - enter the unit as Hours.
9.Primary Saved Search - select Response Time Current Quarter.
10.ShowComparison - select the checkbox to compare data from the previous quarter.
If you do not select this checkbox, you cannot input the secondary data, and therefore you cannot compare data.
11.Secondary Name - enter Previous Quarter Resolution Time.
12.Secondary Saved Search - select Response last Current Quarter.