Voice
Metrics
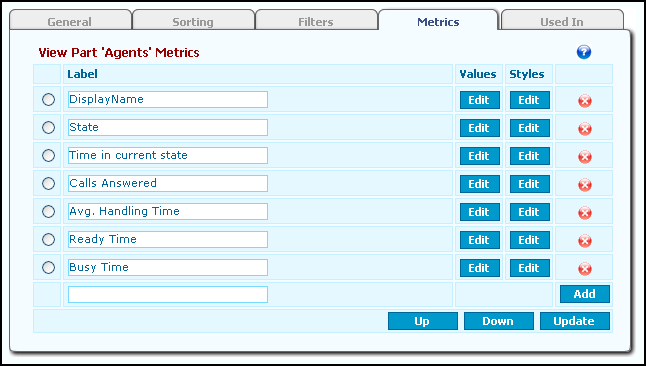
Metrics are the data that populate the view part. The metrics for the view part can be comprised of an image (such as the company logo), a single statistic, or a set of statistics. The Metrics tab lets you:
- Add metrics to the view part and label them.
- Configure the values each metric displays.
- Configure the formatting of each metric.
- Configure the behavior of the view part when the metric data reaches specific thresholds.
- Include a data target.
- Include a drill-down link to view data for a specific user.
- Change the order in which the metrics appear in the view part.
Add Metrics
To Add a Metric to the View Part:
1.In the empty field in the Label column, type the name of the metric as you want it to appear on the user interface.
2.Click the Add button. A new metric line is added to the list along with a Values and Styles column.
3.Click the Update and Commit Changes buttons to enact the change. The metric you added displays on the user interface with an undefined value until you configure it.
You can add and configure multiple metrics
Configure Metric Values
To configure the values for the metric:
- Click the Add button in the Values column. The Metric Values window opens.
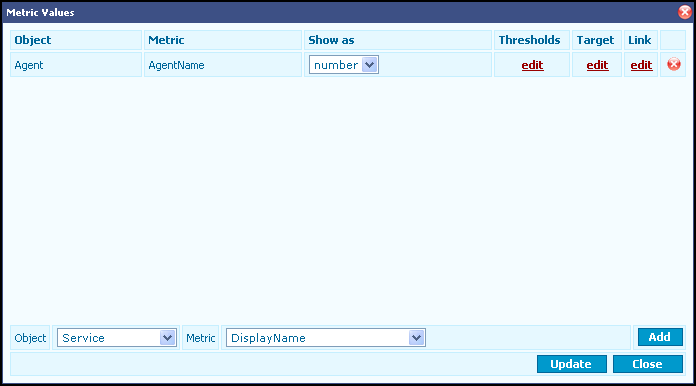
- In the Objects field, select the statistical category (Agent, Agent Group, Service, or Contact Center): the list options depend on which ViewPart Objects were selected when creating the view part).
- In the Metric field, select the statistic you want displayed in this view part. The Metrics options available depend on the Object you selected.
- Click the Add button. The statistic displays at the top of the Metric Values window along with the Show as field and three columns: Threshold, Target, and Link.
- Change the Show as option if needed (to display the metric as a number, text, percent, time, image, or title).
- Configure the metric Threshold, Target, and Link:
- To configure the threshold for the statistic, click the Edit link in the Threshold column. The Metric Threshold dialog box opens. Any thresholds you created for this metric on the Web Statistics > Metrics tab will appear at the bottom of the window. Select the threshold and click Add. The threshold is added to the table. Click the Threshold1 link to select a style for the threshold alert. Click the Back button to return to the threshold list, then click the Back button to return to the Metric Values window.
- To configure the target for the statistic, click the Edit link in the Target column. The Metric Target dialog box opens. Any targets you created for this metric on the Web Statistics > Metrics tab will appear at the bottom of the window. Select the target and click Add. The target is added to the table. Click the Back button to return to the Metric Values window.
- To create a link to drill down to view metrics for a specific user, click the Edit link in the Link column. The Metric Link dialog box opens. In the ViewId field, select the view. In the ForUser field, type the Username (or %Name% if an Agent metric is being used). Click Update, then click the Back button to return to the Metric Values window or click Close to return to the View Parts > Metrics page.
- On the Metric Values window, you can add one statistic for every object (Agent, Agent Group, Contact Center, Service) you selected on the View Parts > General tab.
Example: To create a table that shows calls answered by both agents and agent groups:
•Add one row in which Object = Agent Group, Metric = Number of calls answered, and Show as = number.
•Add a second row in which Object = Agent, Metric = Number of calls answered, and Show as = number.
The result:
Group/Agent | Calls Answered |
Support Group | 25 |
John | 18 |
Peter | 7 |
Sales Group | 15 |
Judy | 10 |
Mike | 5 |
To arrange the data by agents within each agent group, add two sorts on the View Part Sorting tab: add a sort by Agent Name and then by Group Name (listed in that order).
For additional examples, look at the Metrics for the Agents [Table] view part, where an additional statistic is added on the Metric Values window to create a title, and the My Averages [Table] view part, where additional statistics are added to compare agent performance to group and contact center performance.
- Repeat steps 2 through 6c to add and configure more statistics for this metric.
Configure Metric Styles
If you want to override the default styles and size set for this view part on the General tab, you can do so on a metric-by-metric basis. You can choose to use the default styles for some of the metrics of the view part and specify styles for other metrics in the same view part.
To Configure Styles for a Metric:
- On the Metrics tab for the view part, click the button in the Styles column. The Set Metric Styles window opens.
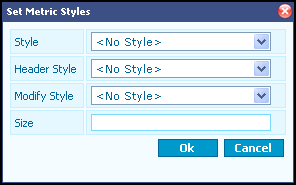
- Use the Style, Header Style, and Modify Style drop-down menus to specify styles for this metric, and the Size field to specify the size. The size can be expressed as pixels or as a percent. If expressed as a percent, type a percent sign. The styles and size you select override the styles and Object size on the General tab for this metric only.
- Click the OK button when finished. The Set Metric Styles window closes.
- Click the Update and Commit Changes buttons to enact the changes.
- On the View Parts > Metrics page, repeat the steps for adding metrics, then configure the metric values and styles until you have added all the metrics needed for this view part.
- The metrics are listed on the View Parts > Metrics page in the order in which they will appear in the view part. To change the order:
•Click the radio button next to the metric, then click the Up or Down button to reposition the metric.
•Click the Update and Commit Changes buttons to enact the change.
Was this article useful?
Copyright © 2019, Ivanti. All rights reserved.