Chart Colors
The Chart Colors page (Web Statistics > Settings > Chart Colors) contains a table that shows the colors the UI utilizes when depicting data in the slices in pie charts, the bars in bar charts, and the lines in tracking graphs.
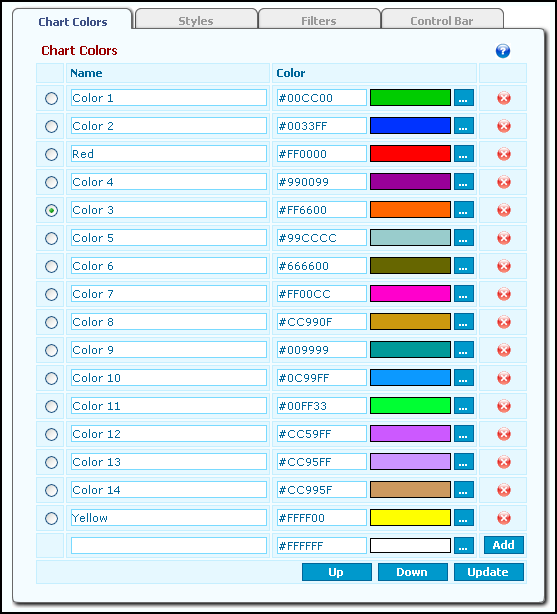
The UI selects the colors in order from the top to the bottom of the list. For example, if the first three colors are green, blue, and red, the user interface uses green for the first object in the table, blue for the second, and red for the third.
To Add a Color to the Table:
1.In the empty field in the Name column, type the name for the color you want to add.
2.In the adjacent Color column, either type the hexadecimal code of the color, or click the browse button and select the color from the palette that opens.
3.Click the Add button. The page refreshes, adding the color to the table.
4.Click the Update and Commit Changes buttons to enact the change.
To Remove a Color from the Table:
1.Click the red x icon.
2.Click OK to confirm the deletion.
3.Click the Update and Commit Changes buttons to enact the change.
To Change the Order of the Colors in the Table:
1.Click the radio button next to the color.
2.Click the Up or Down button to reposition the color.
3.Click the Update and Commit Changes buttons to enact the change.