Infrastructure Monitoring
Use Infrastructure Monitoring to control the most important actions you perform when distributing software packages in your DSM environment. With one mouse-click you can see the information on the current distribution status of the depots and their work and/or install directories.
Infrastructure Monitoring actively issues information on system errors and events. This helps you find and resolve errors in the infrastructure quickly.
In this section you will find the following information on the Infrastucture Monitoring.
Overview
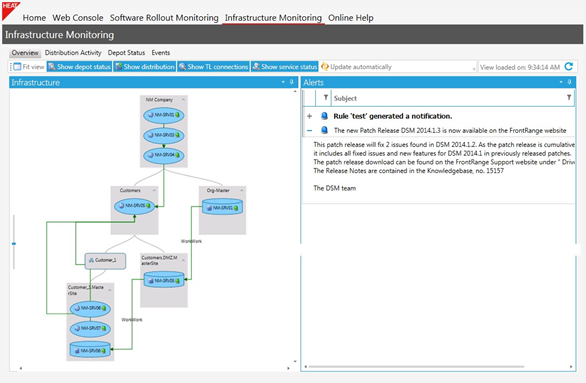
DSM Web displays the Infrastructure status graphically in the Infrastructure Monitoring overview. The graphic display shows the following infrastructure objects: Region, Site, Management Point and Depot. You can also display the status of the individual objects and their "connections".
In addition, the overview shows important system-related messages (warnings) of the DSM environment plus specific events based on user-defined rules and update information from HEAT Software. Click + to read the complete message. If an event recurs several times, the individual incidents are listed as subitems in the message (up to 100).
The message may also contain a reference to the associated log file.
Tasks
The following tasks are available for the graphic display:
•Fit view - Adjusts the view on the infrastructure to the current window size.
•Show depot status - Different icons show the status of the packages in the individual depot. Tooltips provide information on the number of pending and failed packages. Click to open the Depot Status tab.
The depot status shows the distribution "within" the depot, i.e. distribution from the Work to the Install directory.
•Green = the distribution of all packages is finished.
•Yellow = the distribution of at least 1 package is still pending.
•Orange = the distribution of at least 1 package failed.
•Show distribution - Shows the direction of the distribution and the status of the package distribution between two depots. This task shows the distribution from one depot to the next, i.e. Install-Install distribution.
•Green = the distribution of all packages is finished.
•Yellow = the distribution of at least 1 package is still pending.
•Orange = the distribution of at least 1 package failed.
•Show TL connections - Shows available Transport Layer connections between Management Points with a black arrow.
The arrow points in the direction where the connection is being set up.
The system automatically checks the connections. When this check is finished, the arrows turn green or red, depending on whether the connection is working or not.
•Show service status - A green icon shows that the DSM Services are currently running on the Management Point, a red icon shows that they have been (partially) stopped. Tooltips provide information on the status of the individual services.
•Update automatically - Updates the status and the connections of the infrastructure objects every 20 seconds.
•Delete - Deletes the selected message.
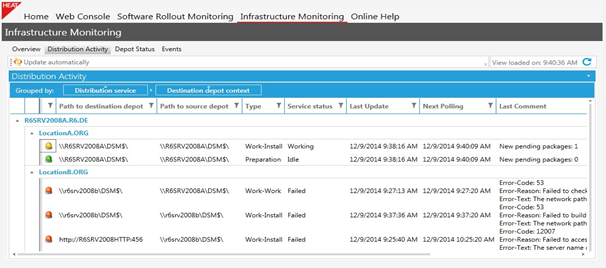
Distribution Activity
Shows the status of the Distribution Services on the respective depot servers. Group the view by dragging a column name on the right to Group by.
Tasks
The following tasks are available:
•Update automatically - Updates the list every 20 seconds.
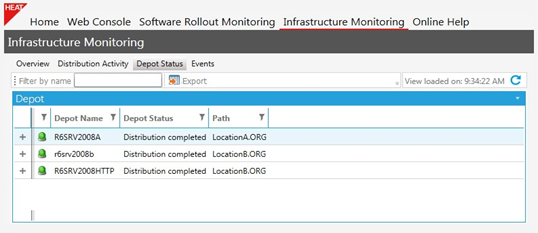
Depot Status
Shows the list of all available depots in the DSM environment. Click + to get further details on the depot directories (Work-Install). Clicking a directory opens another window that contains a list of all software packages residing in this directory.
Tasks
The following tasks are available:
•Filter by name - Shows only depots with the specified name.
•Export - Exports the displayed depots in a CSV file for free use.
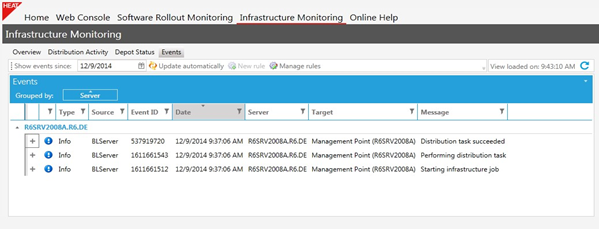
Events
DSM Web shows event messages of the DSM services. Click + to read the complete messages.
Tasks
The following tasks are available:
•Show events since - Reduces the number of the displayed events.
•Update automatically - Updates the list every 20 seconds.
•New rule - Opens a dialog box where you can create a rule for the event you selected. This rule ensures that a warning pops up when the respective event reoccurs.
•Manage rules - Opens a dialog box where you can manage existing rules.
Create New Rule
You can create a rule based on an existing event. When the existing event reoccurs, this rule generates a message in the Infrastructure Monitoring overview.
1.Select the event in the Events tab for which you want to receive a message in the future.
2.Select New Rule in the task bar. This opens a dialog.
3.Select the properties of the event you want to include in the rule. You may chose the following filters (multiple selection is possible): Event(message text), Type, Server and Target.
The rule includes all events whose active properties have the same values as displayed in the dialog.
4.Enter the name of the rule. The name is displayed in an according message.
5.Select Severity to specify which icon will be used for the message.
6.If you want, enter an email address to have the message sent via email. Multiple entries can be made, if the addresses are separated by semicolons.
7.Select Is active to determine whether the rule is active or not.
8.Select Continue on match to specify whether other rules must be evaluated for an event if this specific rule matches the event.
9.Select Create Rule. The rule is stored and immediately applied - if active.
If you want to change the execution order or delete the rule, use the Manage Rules task.
If a message is issued repeatedly in the Infrastructure Monitor and not opened and marked as read, it will continue to reappear underneath the original message!
Manage Rules
Managing existing rules includes deleting rules and/or customizing individual properties or changing the execution order.
1.Select the Manage rules task fromthe Events tab. The Event Rules dialog box pops up.
2.Select an existing rule and change it, if necessary.
3.You can change the following:
•Change the properties Is active, Continue and Mail by entering the information directly in the appropriate column.
•Use the Delete rule task
•Change the execution order by moving the rules around in the list with the Move down or Move up tasks
4.If you want to change other properties of the rule, delete the rule and recreate it with the properties you want.
5.Save your changes.
The rule is stored and the changes are applied, too.
It is important to change the execution order if several rules apply to one event. By combining the properties Continue and Execution order, you can specify that one rule is applied preferably and the other one is ignored.