Software Rollout Monitoring
With Software Rollout Monitoring you can monitor the actual state and the rollout behavior of specific software over a defined period of time. You can document the software rollouts and determine trends that occur while installing software or patch packages.
Queries can be easily created in a monitor and can be displayed in the dashboard. This allows you to evaluate on different detail levels.
Software Rollout Monitoring provides different types of diagrams with which you can display and summarize the available data. You can print the reports or export them to print documents.
Software Rollout Management answers the basic questions about software installations:
•Were the installations finalized successfully?
•Are some installations still pending?
•Where did errors occur?
Examples:
•What is the current status of the new Microsoft Office 2010 installation and how was the installation process over the past 24 hours?
•Which software installations failed over the past 24 hours?
• Which computers need patch xyz and where has the patch been installed already?
•Which security vulnerabilities have been reported and which percentage has been fixed already?
Using the Dashboard
The results from the query definition of the monitor are displayed in a data window on the dashboard. The evaluation will appear in charts (diagrams).
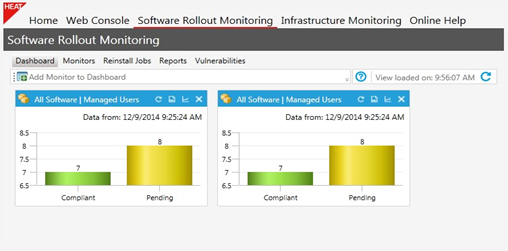
1.Open the Dashboard tab on the menu bar.
2.In the task bar, select the command Add monitor to dashboard. A dialog opens containing a list of all of the monitors you created.
3.Select the monitor you want to display in the dashboard. The respective list columns contain further details on the monitors. In the window on the right you can see a diagram with the evaluation of the monitor like it will be displayed later on in the data window of the dashboard.
4.In the task bar, select Add Items. The result of the monitor is displayed on the dashboard in a new data window.
You can arrange the data windows in any order with Drag & Drop. Move the cursor to the left of the icons and hold on to the data window; then move the data window to any place.
Tasks
The following tasks are also available:
•Show installations
•Reinstall software
•Show historic data
Show Installations
In the dashboard you can switch from the graphic view of a data window to another view where you can see all of the details on a software installation. If you click the data window, you can select from three different installation states:
•Show Successful Installations
• Show Failed Installations
•Show Pending Installations
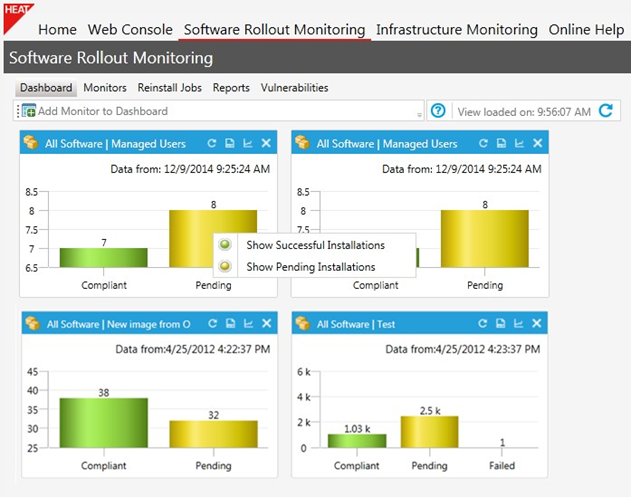
Select one of the three options to get an overview of the rollouts in the next dialog window. The example here shows the successful installations.
Overview of Rollouts with Successful Installations
The dialog window Overview of rollouts with successful installations provides three data windows with the most important information of the relationship between the following objects:
•Software: Software packages with/without revision
•Distribution target: Organizational unit (OU) the software has been assigned to
•Computer: Computer the software has been assigned to.
Filter or sort the view in the respective window to suit your needs.
Software
The upper window contains a list of all software packages that are evaluated according to the monitor definition. The list is already sorted so that the critical or problematical installation are listed in first place. For this, the system calculates the relation between successful, pending and failed installations and then the list is sorted accordingly. Therefore you are able to see the problematical package installations immediately. The pie charts in the Status column show errors and problems that occurred during installation. Distribution Targets
The window Distribution Targets (below left window pane) shows the target object the selected software (revision) has been assigned to. The Installations column in our example here refers to the successful installations.
Computers
In the Computers window (below right window pane) you can see the computer where the installation has been executed successfully (in the example).
Exporting Data
Export the items currently displayed in the window as XML file. All of the available columns will be stored. Please use the following tasks:
•Export Software List
•Export Computer List
•Export Distribution Target List
Reinstall Software
Reinstall software which is highlighted on the left side on all or selected computers. For this, use the following tasks:
•Reinstall software on: selected computers
•Reinstall software on: listed computers
Management Reporting allows you to re-execute installations directly from the web console. This saves you some work and you do not have to switch to the DSM Console. Also it allows you to fix security vulnerabilities immediately on individual computers as soon as they are issued in the Management Reporting evaluation.
When you execute the tasks, the system creates a background job which sets the status of the selected policy instances to pending. These are executed during the next polling of the client.
To select several tasks at a time, press CTRL and use the cursor.
1.Open the Dashboard tab.
2.Click the data window.
3.In the dialog, select Show Failed Installations.
4.In the overview dialog, please select the software package (revision) in the Software window and the distribution target in the Distribution Targets window.
5.In the Computers window, you can select a computer (or several computers) where you want to re-execute the installation.
6.Select the task Reinstall software on: selected computers or ... listed computers.
The system creates an installation job that starts running immediately in the background.
Open the Background Jobs tab to get a history on the execution of the created jobs.
You can export this information as XML file.
Show Historic Data
With Management Reporting you can display the rollout process and the history of software and patch installations. The additional benefit of the Show Historic Data view is that you can recognize a trend for the rollouts and use this specific information to improve following installations or to optimize the whole process.
As soon as you create a monitor, the Auxiliary Service will store a data set every hour which will be used to display the historic data.
1.Open the Dashboard tab.
2.Select a data window and click the Show Historic Data icon in the column header on the right. The Rollout History dialog pops up. The dialog shows you an evaluation of the installations over a 24 hour period.
3.To change the period, please select the Show data of: icon in the task bar: You can customize the period by changing the start and end date manually.
Create Monitor Definition
A monitor is a definition of a database query on the configuration database (DSMDB). Monitors are completely independent of the data set of a dashboard or report. When a user creates a monitor, the system filters the data specified in the definition and then stores it in snapshot intervals defined before. There are two types of monitors: Software monitors with which you can analyze software installations and patch monitors with which you can check patch rollouts for fixing security vulnerabilities.
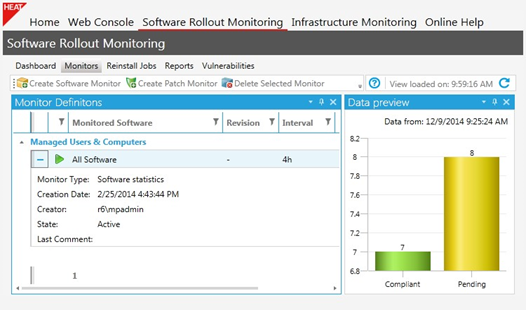
On the Monitors tab in the left window pane you can see a list of the monitors you created. In the right window pane you can see the results of a monitor. You can select a monitor on the left and see the results of the database query immediately. The list has the advantage that you can check each monitor individually and decide at once whether the result displayed in the dashboard is relevant or not.
Tasks
The following tasks are available in this menu. Use these tasks to create or delete new monitor definitions or provide them as additional data set to the dashboard:
•Create Software Monitor
•Create Patch Monitor
•Delete Selected Monitor
•Add Monitor to Dashboard
Create A Software Monitor
Select the task Create Software Monitor if you want to create a new monitor for software installations. This opens the window where you can create a software monitor.
1.On the Monitor tab, select the Create Software Monitor task. The system opens a new, three-paned dialog window.
2.Select a context in the left window pane where you want to search for software installations. In the Selected OU window you can see all objects of the organization tree you can assign software to.
3.You can limit the selection by selecting other child organizational units.
4.Select a software package in the middle window for which you want to display the scope of installation. The Selected Software window contains all software packages you can see in the Global Software Library.
Exception: You can only see the patch packages by opening the Create Patch Monitor task.
5.Select a software or use the Select all software packages task for all software packages.
In the right window pane you can see your selection: It shows all policy instances that have been created for the selected patch package, in the selected revision and for all computers below the selected organizational unit. In the selected organization unit you can see the number and the installation status of the assigned software revisions.
6.Select the Create task if you want to create a new software monitor or select the task Create and add to dashboard if you want to create a new software monitor and show it on the dashboard.
7.Set the snapshot interval for the data update. Select the tab Snapshot every [x] hours and modify the value. Per default a monitor on container objects is set on 4 hours, on software packages 1 hour.
Filter the list to arrange it clearly and to limit the selection:
•Text box: Enter a key word. All packages are displayed whose names contain the key word.
•Show all revisions: Use this task to expand the list with all of a package's known revisions. This allows you to run evaluations on revision level.
•Filter box: In the header of the Name and Revision columns.
Create Patch Monitor
Select the task Create Patch Monitor if you want to create a new monitor for patch installations. The window where you can create a patch monitor will open. DSM Web displays patch packages of the Classic and Advanced Patch Mangement as well.
1.On the Monitor tab, select the task Create Patch Monitor. The system opens a new, three-paned dialog window.
2.Select an OU in the left window pane where you want to check for software installations. In the Selected OU window you can see all objects of the organization tree you can assign a patch to. You can limit the selection by going to another context below.
3.Select a patch package fromthe middle window. The Patches and Updates window contains all patch packages you can see in the Global Software Library in the Patch Library folder.
4.Select an individual patch package or select all packages with the All Patches task.
In the right window pane you can see your selection: It shows all policy instances that have been created for the selected patch package, in the selected revision and for all computers below the selected organizational unit. In the selected context you can see the number and the installation status of the assigned patch package revisions.
5.Select the Create task if you want to create a new patch monitor or select the task Create and add to dashboard if you want to create a new patch monitor and show it on the dashboard.
Filter the list to arrange it clearly and to limit the selection:
•Text box: Enter a key word. All packages are displayed whose names contain the key word.
•Show all revisions: Use this task to expand the list with all of a package's known revisions. This allows you to run evaluations on revision level.
•Filter box: In the header of the Name and Revision columns.
Delete Monitor
1.Select a monitor. Press CTRL and click on the monitors you want to select.
2.Select the task Delete Selected Monitor.
3.Confirm the dialog. The monitor is deleted.
Add Monitor to Dashboard
1.Select a monitor (or several monitors) you want to display in the dashboard. The right window pane contains a graphic display of the monitor's evaluation. The list columns contain details on a monitor.In the task bar, select the command Add monitor to dashboard.
The result of the monitor will be added to the dashboard in the background as a new data window.
Reinstall Jobs
This dialog contains all of the installations that are currently being executed (which you started from Software Rollout Monitoring). They are divided into installations that are still running or that are finished. Background jobs are visible for 7 days. There is a daily update where all background jobs older than 7 days are deleted from the system.
Tasks
Select the Export Job List task to export the displayed list.
Using Reports
With the integrated PDF Writer you can create and distribute reports on running rollouts.
1.Open the Reports tab.
2.Select the task Create Report. This opens the data window of all existing monitor definitions.
3.Select a monitor (or several monitors) you want to issue a report for.
4.Select the task Add report items. The new report is added to the list of reports and highlighted.
5.Click the name of the report and press F2 to change the name.
6.Confirm by pressing Enter. The dialog pane on the right shows the monitors that are issued in the report.
Public Report Option
If you created a report, only you will be able to see it at first. You can specify the Public Report option so that other users of Management Reporting can view the report.
Change a Report
A report can only be changed by the user who created it. You can add monitors, remove them from the report or change the order of the monitors.
1.Open the Reports tab.
2.Add report item:
•Select the report you want to change.
•Select the task Add Report Items. Select the required monitor in the Monitor dialog and add the respective item.
3.Delete report item:
•Select the report you want to change and then the monitor you want to remove fromthe report.
•Select the task Delete Report Items.
4.Change the item order:
•Select the report you want to change and then the monitor you want to move up or down in the list.
•Select the task Move Report Item Up or Down.
The users of public reports are only able to change the order of the monitors.
Rename a Report
1.Open the Reports tab. The dialog shows the reports that have been created already.
2.Select a report.
3.Press F2.
4.Rename the report.
5.Press Enter to confirm.
Print a Report
The printed report contains all the information on the rollout of the software which you defined in the report earlier.
Date
Every report you print out contains the current date and the time of the data collection.
Rollout Summary
A report summary is issued if you specify the Include Summary option.
<Software package><revision> for <distribution target>
Installations are grouped according to their status (successful, pending, failed)
Rollout Trend
A rollout trend is displayed if you specify the Include Trend option for the report item.
Rollout trends are issued in the following intervals: 24 hours (day), 7 days (week), 31 days (month)
Check Security Vulnerabilities
As a support for Patch Management, Management Reporting provides a special Vulnerabilities tab. On the distribution target level you can get an overview over the rollouts of the open security vulnerabilities in your environment. This view does not include fixed security vulnerabilities. DSM Web shows all vulnerabilities which were identified by the Classic and Advanced Patch Management.
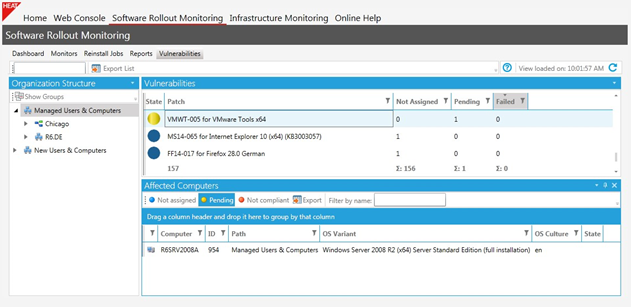
Reduce the list with a filter or a selection in the Organization structure. You can export the patches to a csv file by selecting Export list.
A colored pie chart icon shows the status of the individual patches.
The colored portions of the pie chart icon show the percentage of the affected computers with one of the following status:
•Blue = Not assigned - The patch has not been assigned to the computer yet even though there are vulnerabilities.
•Yellow = Pending - The patch has been assigned to the computer but it still needs to be installed.
•Orange = Not compliant - The patch has been assigned to the computer but the installation failed.
•Green = Compliant - The patch has been assigned to the computer and has already been installed successfully. Patches with this status do not appear in the overview because there is no vulnerability left. The status icon for a patch may contain a green portion if the vulnerability has already been patched on some of the affected computers.
After selecting a patch, the affected computers are displayed in the bottom part of the window. If you want, you can filter the computers by their status (e.g. Pending) or by their name. A list of the affected computers can also be exported to a csv file by selecting Export, same as with the patches.
If you want to start the installation of a patch package, please define a new patch monitor and then run a background job.
Tasks
The following tasks are available:
•Filter by name - This list only shows security vulnerabilities or computers that have a name by which it can be filtered.
•Export - Exports the displayed security vulnerabilities or computers to a csv file for further use.
•Show groups - Displays DSM groups as well.