Application Security Dashboard: Overview
Summary: High-level overview of the Application Security Dashboard.
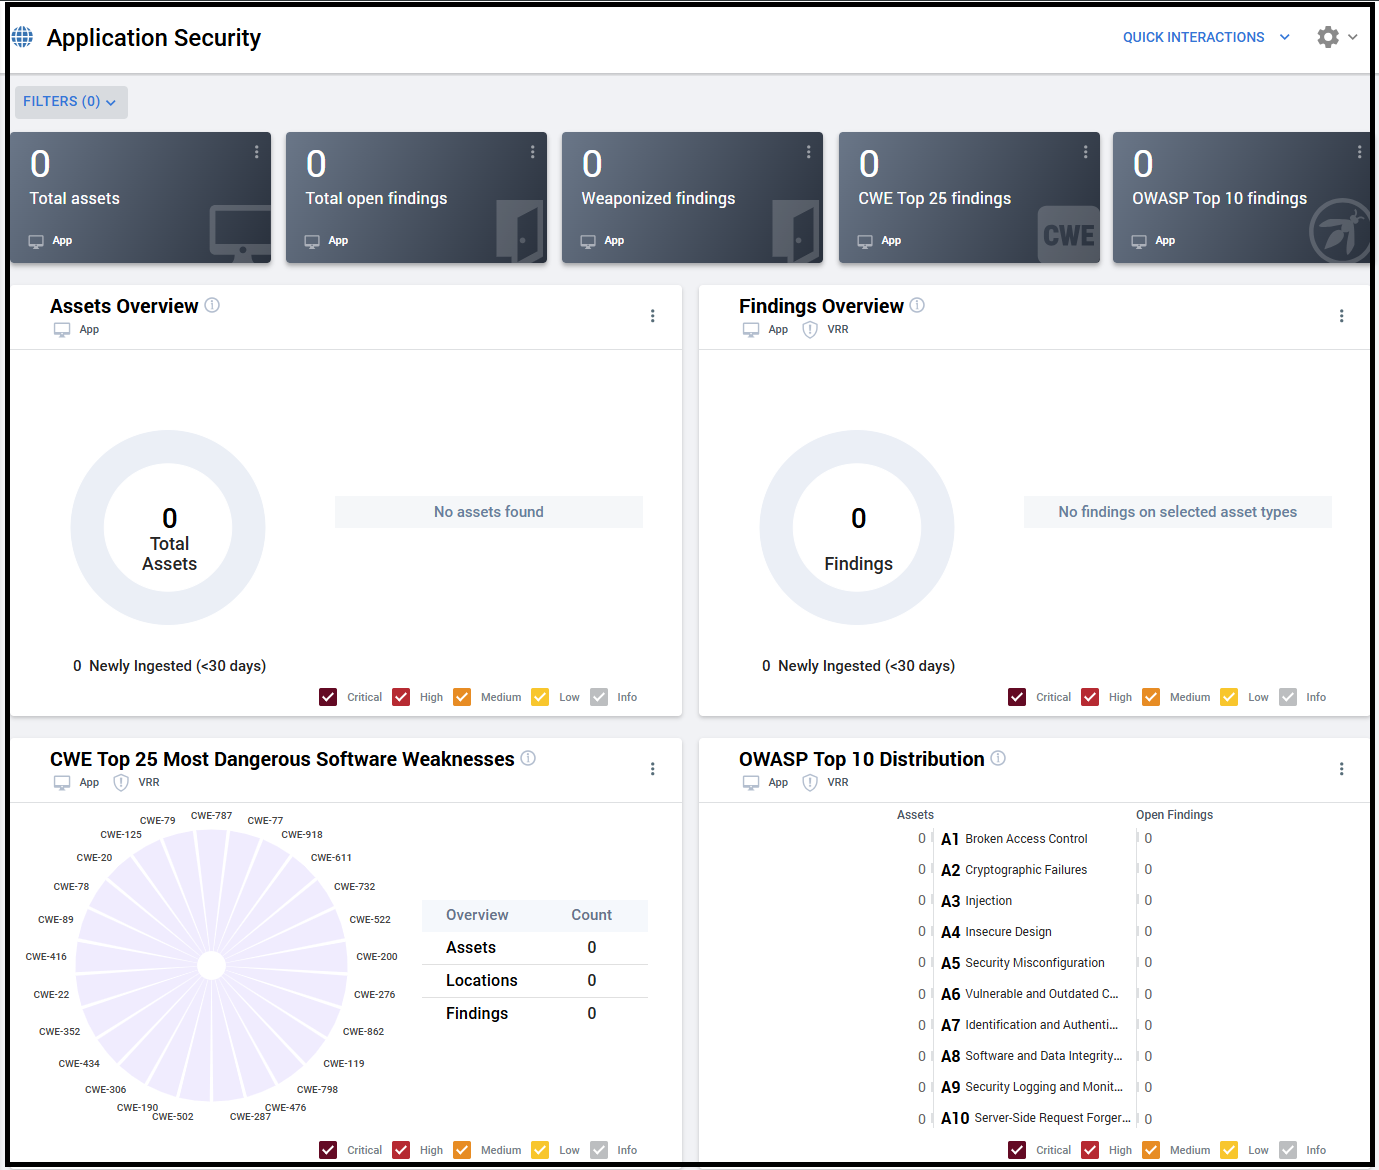
The Application Security Dashboard provides an overview of your organization's application security posture and security testing strategies. It also highlights the top software weaknesses impacting your applications.
Several widgets provide an overview of your application security:
-
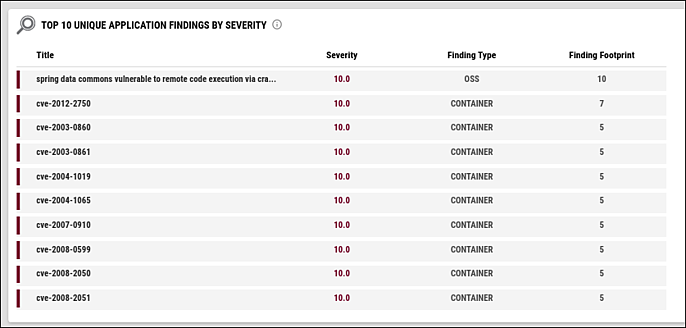
Top 10 Unique Findings shows the top 10 unique application findings with the highest severity and footprint across your applications.
-
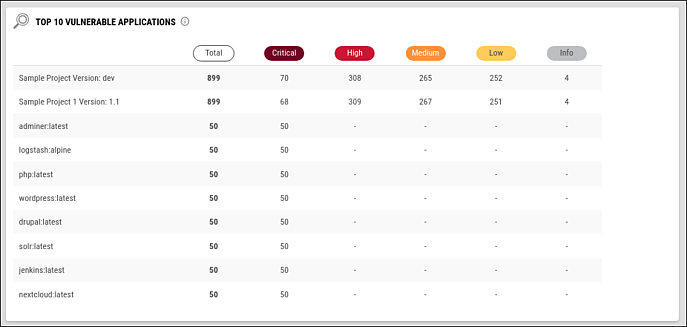
Top 10 Vulnerable Assets shows the counts of Critical, High, Medium, Low, and Info findings on the top 10 assets with the most high-risk findings.
-
Findings First Ingested vs. Resolved addresses remediation activity. It contrasts finding ingestion and resolution over time.
Use both the widgets Application Findings by Type and Top 10 Unique Findings to analyze your organization's security testing strategies. Both widgets show the finding type of each finding. Within the application context, the finding type refers to the type of security tool that generates the finding. Application Findings by Type focuses specifically on the open application findings reported by Static Application Security Testing (SAST), Dynamic Application Security Testing (DAST), and Open-Source Security (OSS), and container security tools.
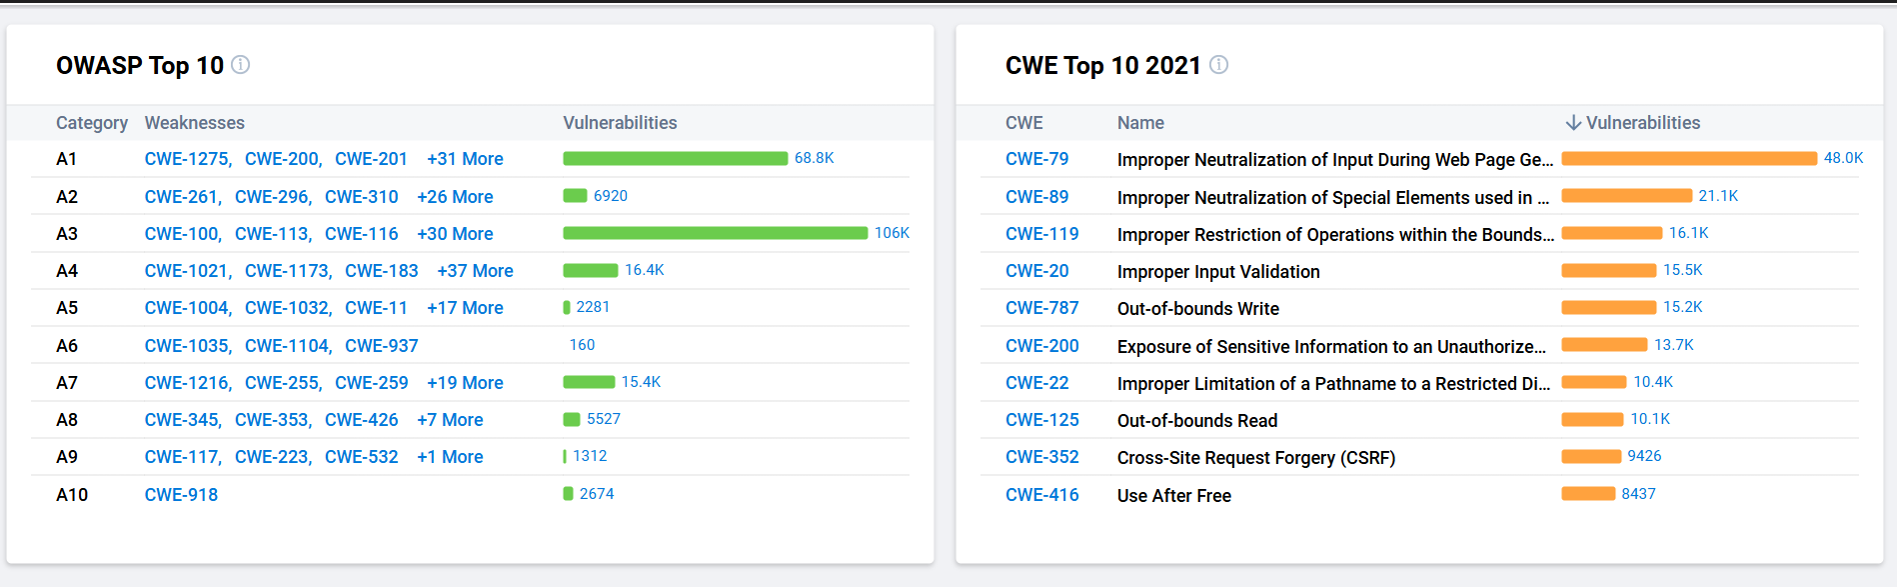
To highlight key software weaknesses, the Application Dashboard shows how open application findings relate to the 2017 OWASP Top 10 Security Risks (OWASP Top 10) and the 2019 CWE Top 25 Most Dangerous Software Errors (CWE Top 25). Open Application Findings with Top Software Weaknesses provides counts of open findings related to the CWE Top 25 and the OWASP Top 10. The widget OWASP Distribution shows many applications and locations on those applications that each OWASP category impacts. CWE Top 25 Most Dangerous Software Errors provides the same information for each of the 2019 CWE Top 25.
Widgets
Assets: This chart shows counts of assets and open asset findings, etc. that match active filters.

Assets Overview: This chart shows the number of open application findings by type. The finding types featured (SAST, DAST, OSS, and Container) describe application security and container security tools:
-
Static Application Security Testing (SAST) tools search the application source code for vulnerabilities.
-
Dynamic Application Security Testing (DAST) tools interact with running software applications to find vulnerabilities and mimic attacks on applications.
-
Open-Source Security (OSS) tools can determine whether security vulnerabilities exist in open-source components or assist with internal audits of open-source components.
-
Container scanners identify vulnerabilities and configuration errors in container images.

Open Application Findings with Top Software Weaknesses: This chart shows counts of applications and open application findings that match active filters.
Top 10 Vulnerable Assets: This chart shows the top 10 vulnerable assets ranked first by their Critical open finding count, then High open finding count, then Medium open finding count. For each application, the chart displays the total open finding distribution by Severity. Note that if dashboard filters include tags, this chart will only show data for tags applied to assets.
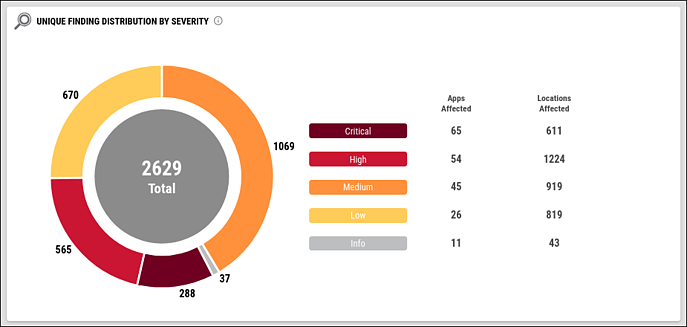
Unique Finding Distribution by Severity: This chart shows a Severity-based distribution of unique Critical, High, Medium, Low, and Info application findings. A unique finding describes a grouping of open application findings with the same scanner plugin and Severity. The chart also shows the counts of application assets and application locations with Critical, High, Medium, or Low, or Info findings.
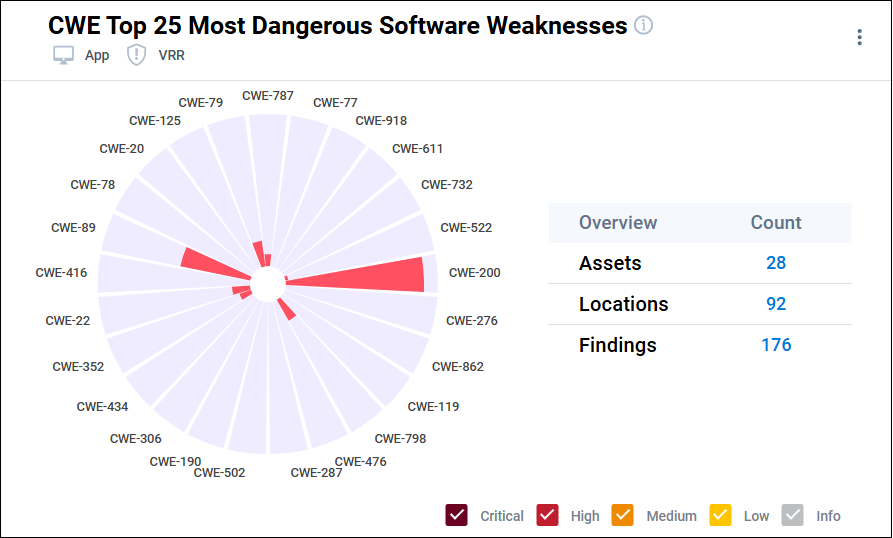
CWE Top 25 Most Dangerous Software Weaknesses: The 2019 list of top CWEs, the CWE Top 25, ranks common software weaknesses by how frequently they occur in the wild and how much risk each one presents to an organization’s data or operations. This chart shows the number of open findings that map to each of the top 25 software weaknesses. On the right, the chart also shows the number of impacted applications, application locations, and open findings corresponding to any of the CWE Top 25. When this chart appears in a dashboard, you can interact with the chart to see the counts for a specific CWE.
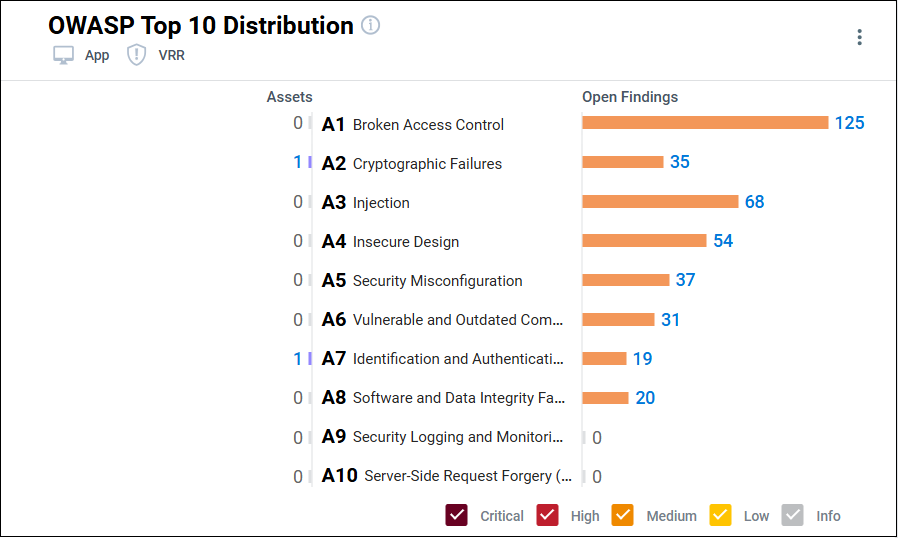
OWASP Top 10 Distribution: This table shows how the 2017 OWASP Top 10 Security Risks impact application assets. For each OWASP, the table shows counts of affected applications and application locations. The table also shows the number of related open findings.
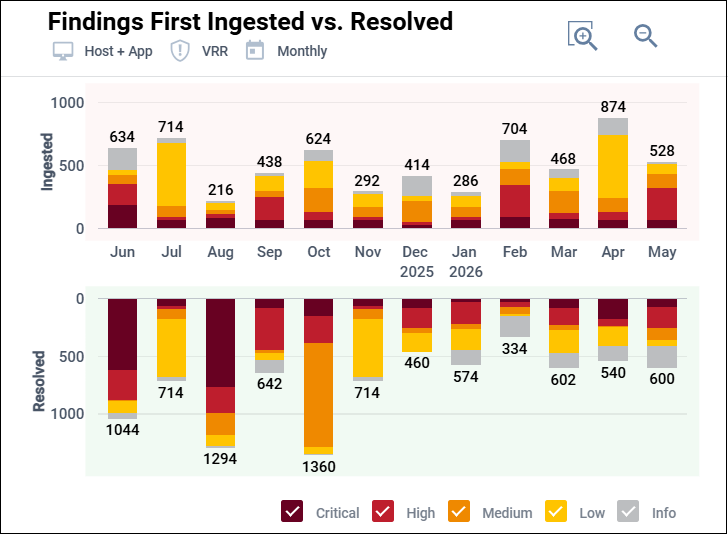
Application Findings Ingested vs. Resolved: By default, this chart shows the number of findings ingested vs. the number of findings resolved over the last 12 months (including the current month). The chart also has Daily, Weekly, and Quarterly modes that show counts for the last 12 days, 12 weeks, or 12 quarters.
Top 10 Unique Application Findings by Severity: This table shows the top 10 unique application findings ordered by highest Severity and then by the number of related open application findings. Each unique finding describes a scanner plugin that maps to at least one open application finding. For each unique finding, the table shows the highest Severity of all related application findings, its finding type, and the total number of related application findings (its finding footprint).