Group By Usage Guidelines
Summary: Usage guidelines for the Group By feature in Ivanti Neurons.
Group By allows you to gain more meaningful and actionable insights from asset and finding data. This article suggests strategies for finding the most relevant results and outlines certain caveats and limitations that the user should keep in mind when using this feature. The feature has been optimized to display the “top X results”, where X is less than a few hundred items.
The platform can display at most 1,000 results and up to 150 results per page. In some cases, a Group By operation can return hundreds or thousands of results. The only way to view all results is to export the entire dataset.
1000 Item Limit in Group By View
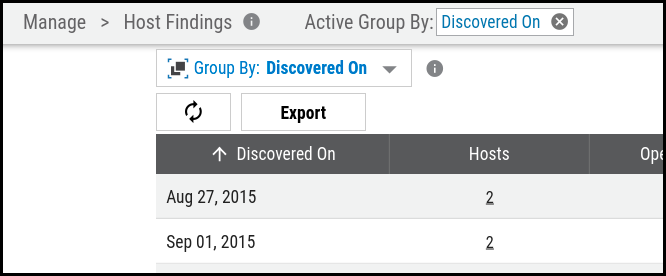
The Group By service returns up to the first 1000 items. To find the results most relevant to you, try to narrow your search by adjusting your filters or by sorting your results by a different column.
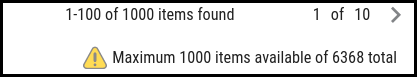
If the full dataset contains more than 1000 items, you will see an alert under page navigation.
Once the Group By view loads, you can export the entire dataset to a CSV, JSON, or XLSX file.
Accuracy
The Host Findings and Application Findings Group By may provide estimates for counts within 1-5% of the actual values:
-
For each Host Findings Group By, the impacted columns include “Hosts” , “Threats”, “Open CVEs”, and “Fixes”.
-
For each Application Findings Group By, the impacted column is “Applications”.
Exports
In the Group By view, values greater than or equal 1000 are truncated and shown with the appropriate suffix (1K for 1,000, 1M for 1,000,000, etc.). Exports show the original estimates for each column.
Sorting
If you sort the dataset by any other column than the Group By column (the first column), you may experience a delay while waiting for results. You are performing a more computationally expensive operation.
You can only sort by the Group By column if the total size of the dataset exceeds 100,000 items.
Filtering
Dashboards often show metrics for open findings. You may have to apply the Status filter to see similar numbers when you do a Group By operation on host findings or application findings. Only certain columns show metrics based on the status of a finding. Examples of these columns include “Open Findings” and “Closed Findings”.