Multi-Client Dashboard: Overview
Summary: High-level overview of the Multi-Client Dashboard.
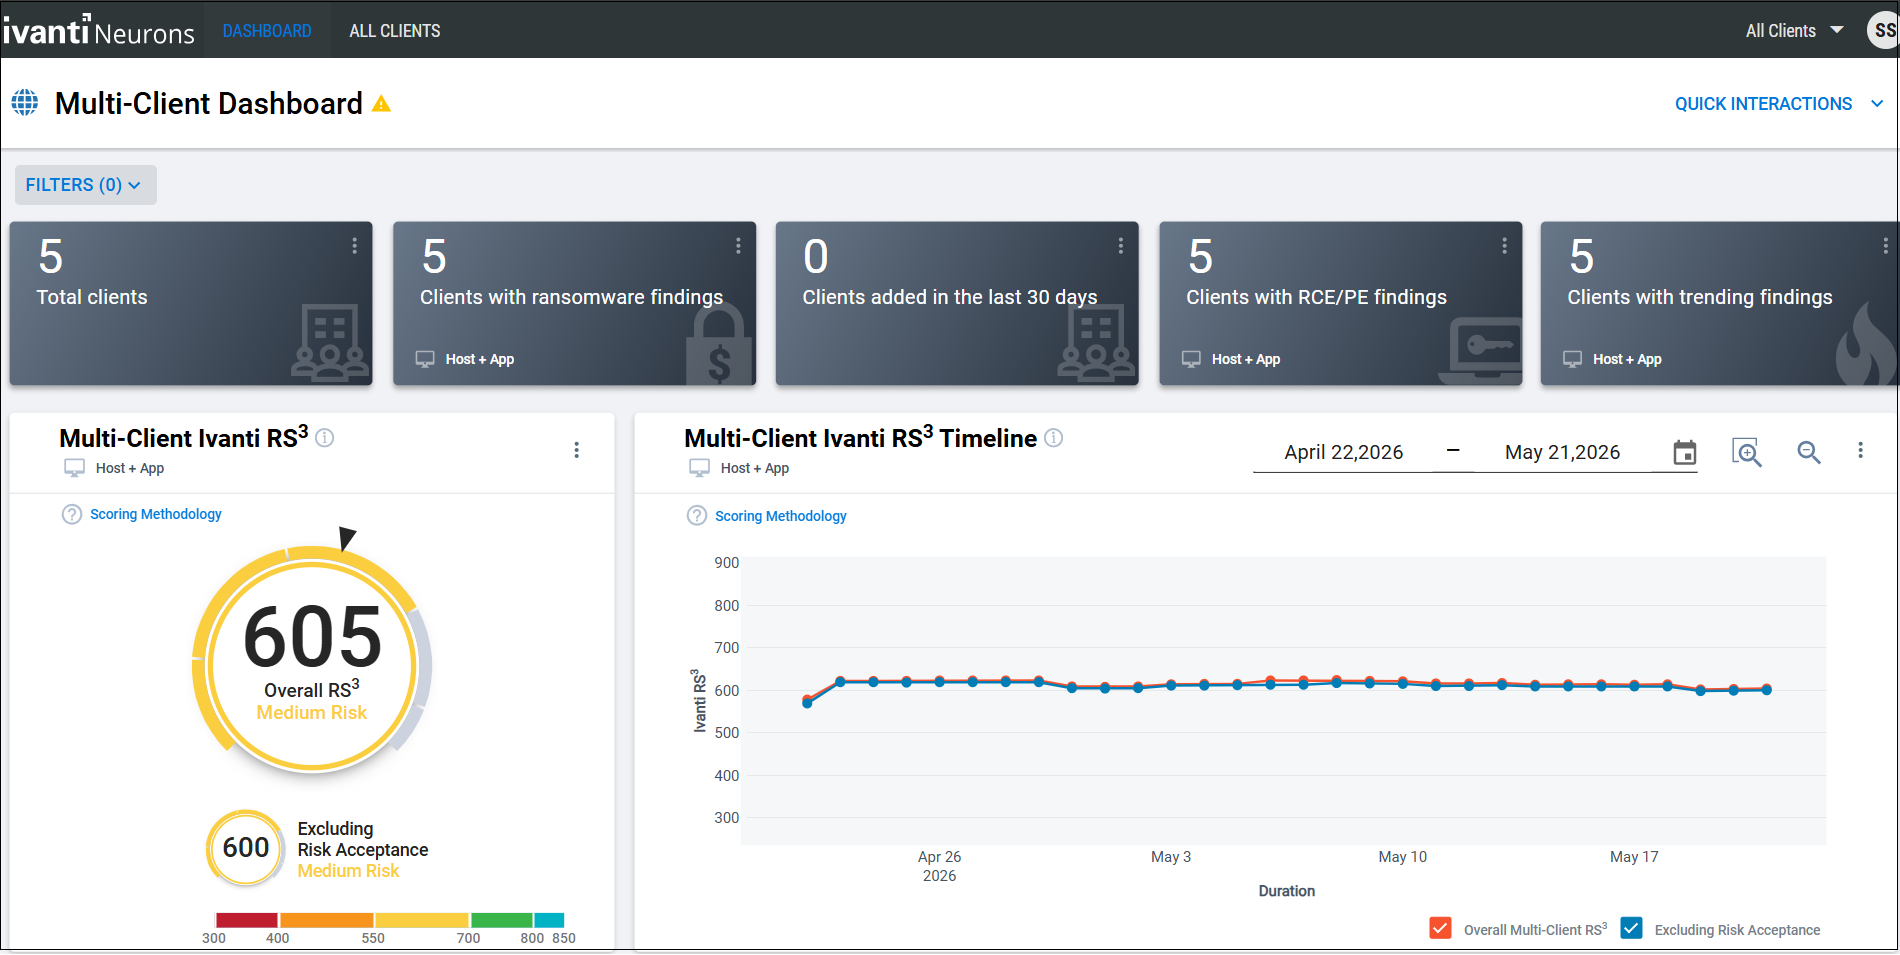
Users with multiple clients have access to the Multi-Client Dashboard and the All Clients page. The Multi-Client Dashboard provides a high-level overview of client performance. The All Clients page presents a summary of key metrics for each client individually and lets users export those key metrics.
The Multi-Client Dashboard includes both host and application findings and highlights the number of findings and assets that clients should prioritize first. If users need to capture metrics for specific clients, they can filter the dashboard on specific client names.
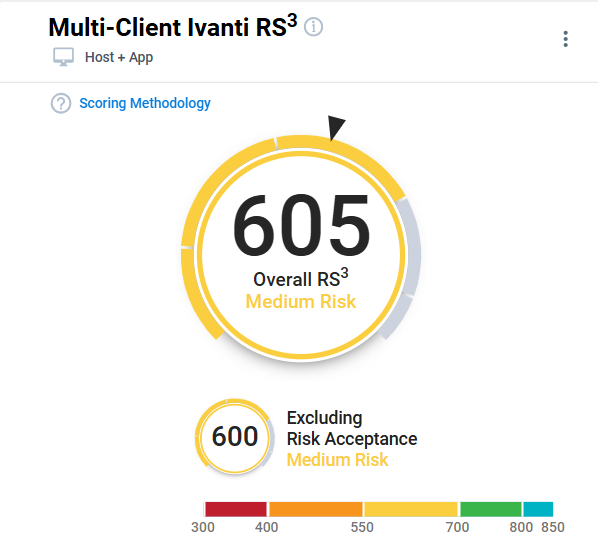
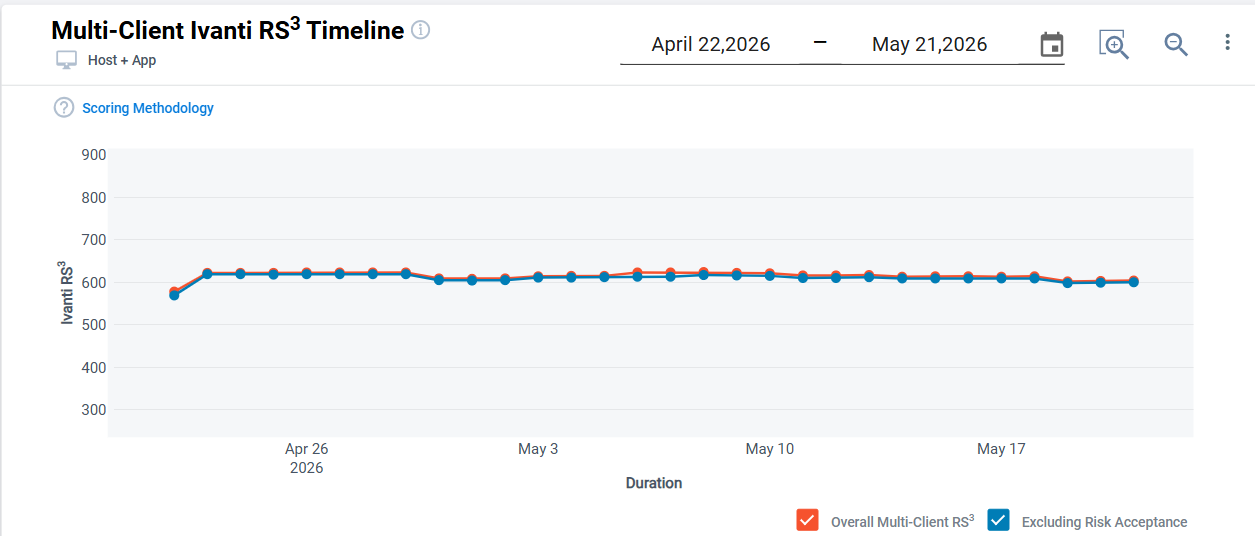
At the top, the Multi-Client Dashboard shows total number of hosts and applications across all clients and the number of open findings on those assets. The middle of the dashboard provides information on the overall performance of all clients in an organization as well as the ability to compare the performance of individual clients. This information is conveyed by the Multi-Client RiskSense Security Score (RS³), which shows the average of every client's current overall RS³. The Multi-Client RiskSense Security Score (RS³) Timeline shows changes in the average multi-client RS³ over the last 30 days.
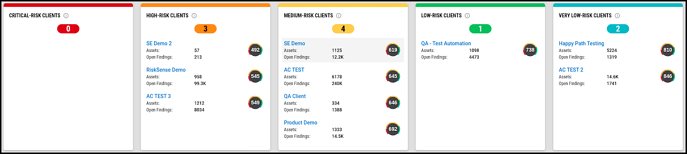
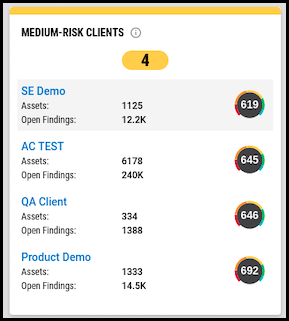
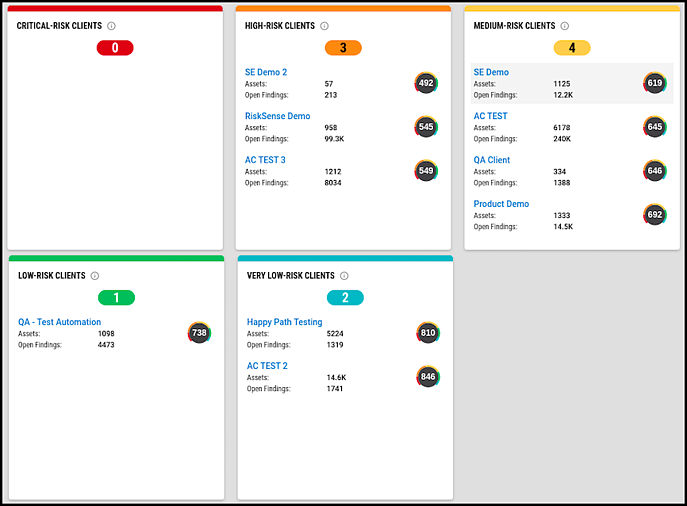
The next section allows you to review individual client performance. The five widgets Critical-Risk Clients, High-Risk Clients, Medium-Risk Clients, Low-Risk Clients, and Very Low-Risk Clients show clients by RS³ range. You can also click a client’s name to access that client.
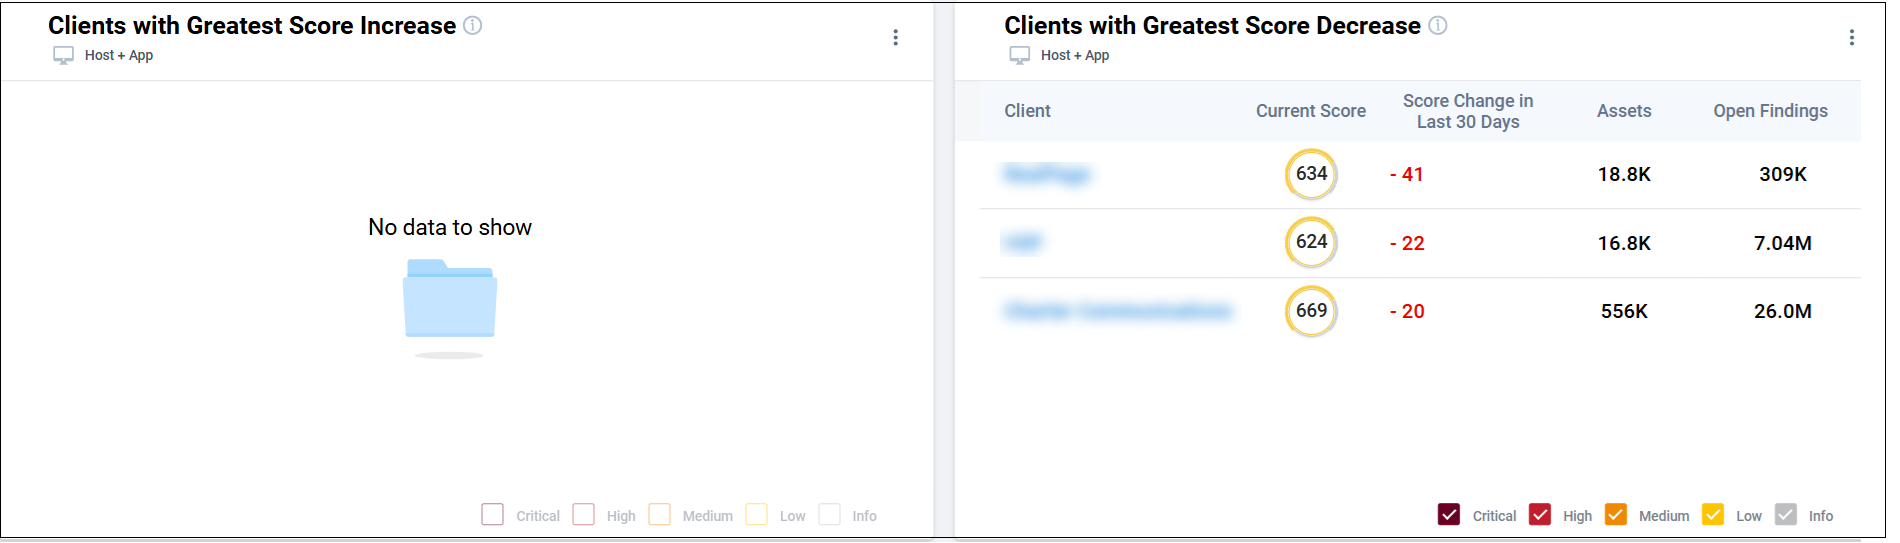
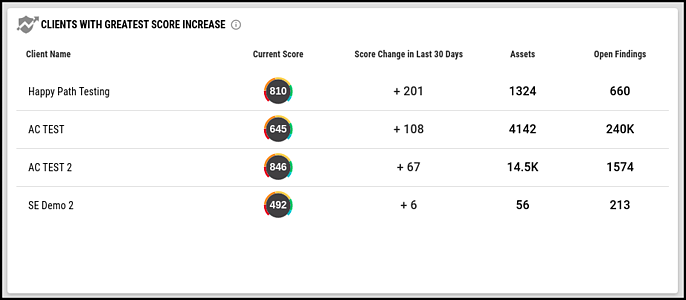
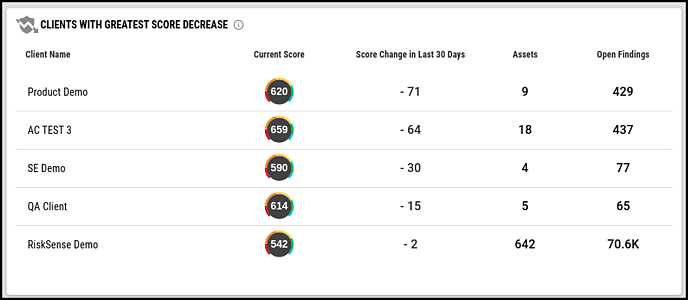
In the next row, Clients with Greatest Score Increase and Clients with Greatest Score Decrease show the top 5 individual clients with the greatest increase or decrease in overall RS³. For each client listed in these tables, their “Score Change in Last 30 Days” conveys the net difference in overall RS³ between the current date and 30 days prior. If that number is positive, the client will be listed under Clients with Greatest Score Increase tile. If that change is negative, they will be under Clients with Greatest Score Decrease.
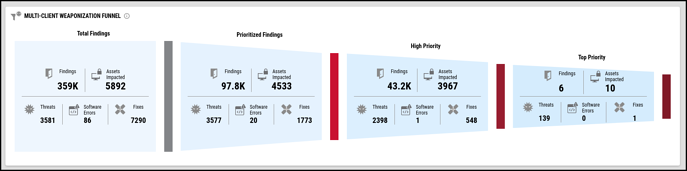
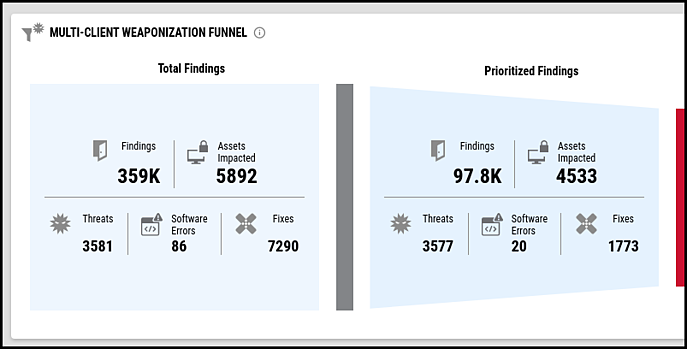
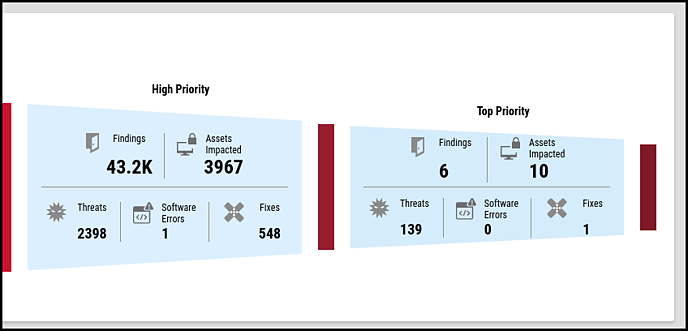
At bottom of the dashboard, the Multi-Client Weaponization Funnel shows categories of findings associated with increasing levels of risk and related metrics such as the number of assets impacted and available patches.
Accessing the Multi-Client Dashboard
If you have access to more than one client, you will see the Multi-Client Dashboard when you first log into RiskSense. The Navigation bar at the top also provides a link to the Multi-Client Dashboard and All Clients page within the client search drop-down. Click All Clients to go to the Multi-Client Dashboard.

Navigating Between Clients
Use the client search drop-down in the top Navigation bar to switch between clients at any time. To open the client search, click the triangle next to the name of your current client.
You can also go to another a client by clicking the client’s name on the All Clients page or by clicking on the client’s name in one of the five widgets that shows clients by RS³ range (Critical-Risk Clients, High-Risk Clients, Medium-Risk Clients, Low-Risk Clients, and Very Low-Risk Clients).
Filtering the Multi-Client Dashboard
Open the Filters menu on the left to search for one or more clients. When you add a new filter, the dashboard then updates to only show clients that match it.
Differences between the Multi-Client Dashboard and Configurable Dashboards
The Multi-Client Dashboard and Configurable Dashboards have several differences. Since the Multi-Client Dashboard presents provides metrics on all clients, most widgets lack clickable links to other pages in the platform. The Multi-Client Dashboard supports the Client Name filter rather than Network, Group, and Tag. Additionally, the Multi-Client Dashboard also handles platform permissions differently:
-
Users see all data in all groups regardless of what group permissions that they have in individual clients. When viewing dashboards within a client, users lack the ability to see assets outside of their assigned groups.
-
If a client has an IP whitelist that excludes the user’s IP address, the Multi-Client Dashboard excludes the client’s data. The Multi-Client Dashboard alerts the user to the conflict by displaying an icon at the top. The alert icon also appears at the top of the All Clients page as well.
-
The Multi-Client Dashboard supports more frequent updates to the patch count for open findings. The Multi-Client Weaponization Funnel and the All Clients page refer to the patch count as “Fixes”. Within a single client, the Patches page and widgets that show Fixes update nightly.
Widgets
This section provides an overview of widgets in the Multi-Client Dashboard. Widgets show information only for clients that match active filters. Where the widget description refers to “all clients”, it actually refers to all clients that match active filters.
Clients
This widget shows the number of clients for which the dashboard shows data.
Multi-Client RiskSense Security Score (RS³)
This widget shows the average RS³ score for all clients and the average Risk Accepted RS³ for all clients. The “multi-client” RS³ or Risk Accepted RS³ is the average of each client’s overall or Risk Accepted RS³.
Multi-Client RiskSense Security Score (RS³) Timeline
This widget shows changes in the multi-client RS³ and Risk Accepted RS³ over the last 30 days.
Critical-Risk Clients, High-Risk Clients, Medium-Risk Clients, Low-Risk Clients, and Very Low-Risk Clients
These 5 widgets show the clients within a particular RS³ range. These 5 widgets also show the total number of host and applications and open findings on each client. RS³ ranges include
-
300 to 399 (Critical-Risk Clients)
-
400 to 549 (High-Risk Clients)
-
550 to 699 (Medium-Risk Clients)
-
700 to 800 (Low-Risk Clients)
-
800 to 850 (Very Low-Risk Clients)
These widgets also let you navigate to a specific client by click the client’s name.
Dashboard View:
Close-Up View of Individual Widget:
Close-Up View of Widgets:
Clients with Greatest Score Increase
This widget shows the 5 clients that have had the greatest increase in overall RS³ over the past 30 days. It also shows the total number of hosts and applications and open host and application findings on each client.
Clients with Greatest Score Decrease
This widget shows the 5 clients that have had the greatest decrease in overall RS³ over the past 30 days. It also shows the total number of hosts and applications and open host and application findings on each client.
Multi-Client Weaponization Funnel
The Multi-Client Weaponization Funnel presents categories of host and application findings in order of increasing risk. Each section of the funnel shows a count of open findings associated with one or more types of threat or software weaknesses. Each section of the funnel includes both a count of unique threats and, if available*, a count of software errors (unique CWEs) associated with open findings.
* The Multi-Client Weaponization Funnel only shows software errors only if at least one client has RS³ v2 enabled.
Dashboard View:
Close-Up View of Left Half of Funnel:
Close-Up View of Right Half of Funnel:
Prioritization in the Multi-Client Weaponization Funnel
Prior to the release of RS³ v2, the finding categories Prioritized Findings, High Priority, and Top Priority only include host findings and application findings associated with CVEs. With the release of RS³ v2, the Multi-Client Dashboard will use the terms Total Findings, Prioritized Findings, High Priority, and Top Priority to refer to both host findings and all types of application findings.
RiskSense’s Vulnerability Risk Rating (VRR) system utilizes several factors to score findings with and without associations to CVE-based threats (weaponization) and trending vulnerabilities. While some application findings may identify weaponized vulnerabilities, an application finding’s VRR often depends on industry standards like the OWASP Top 10 and CWE Top 25 Programming Errors as well as data mining of scanner information.
The table below discusses each category in the Multi-Client Weaponization Funnel.
|
Risk |
Total Findings |
Prioritized Findings |
High Priority |
Top Priority |
|---|---|---|---|---|
|
Weaponized or trending vulnerability |
All open findings |
Weaponized findings |
Findings associated with Remote Code Execution or Privilege Escalation |
Findings associated with trending vulnerabilities |
|
Software weakness |
All open findings |
Findings associated with exploitable software vulnerabilities (CWEs, OWASP Top 10, vulnerabilities named in scanner-provided text) |
Findings associated with malicious code injection (SQL, code, or command injection) |
N/A |