Prioritization Dashboard: Overview
Summary: A high-level overview of the updated Prioritization Dashboard in Ivanti Neurons RBVM/ASPM/VULN KB.
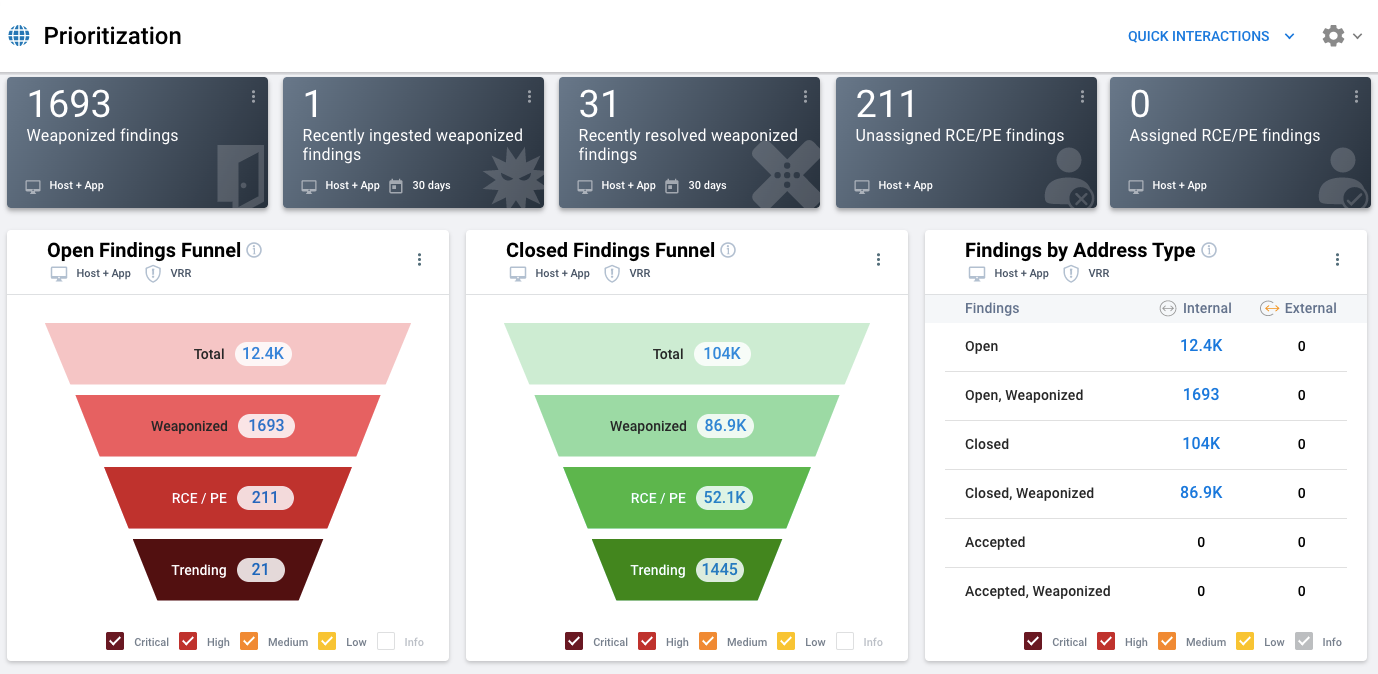
The Prioritization Dashboard allows your organization to quickly observe remediation progress and easily determine where efforts should be directed. Findings are categorized by status and then broken down further by increasingly specific threat associations. The threat-focused charts and tables assist users with prioritizing findings based on several factors. These factors include risk, asset address type, and finding age.
KPIs
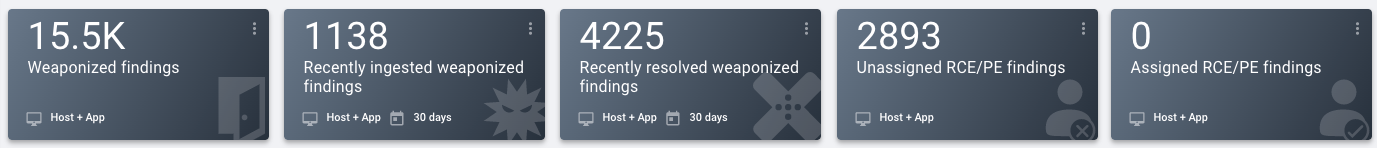
The top line of widgets consists of key performance indicators (KPIs). These widgets highlight how much progress the organization has made toward remediating findings associated with threats. They provide a comprehensive view of both network and application assets. Unlike the configurable widgets on the Prioritization Dashboard, KPIs are not resizable.
The KPI widgets include the following:
-
Weaponized findings: The count of open findings associated with threats.
-
Recently ingested weaponized findings: The count of weaponized findings first ingested within the last 30 days.
-
Recently resolved weaponized findings: The count of weaponized findings closed within the last 30 days.
-
Unassigned RCE/PE findings: The number of unassigned findings associated with remote code execution (RCE) or privilege escalation (PE) exploits.
-
Assigned RCE/PE exploits: The number of assigned findings associated with RCE or PE exploits.
Configurable Widgets
By default, configurable widgets on the Prioritization dashboard show all findings and, if applicable, also show the distribution of findings by VRR. The setting Asset Type determines whether the widget shows host data, application data, or both. The setting Scoring Metric controls whether the widget uses VRR or Severity (CVSS) as the measure of risk.
This section describes each configurable widget on the Prioritization Dashboard.
Open Findings Funnel
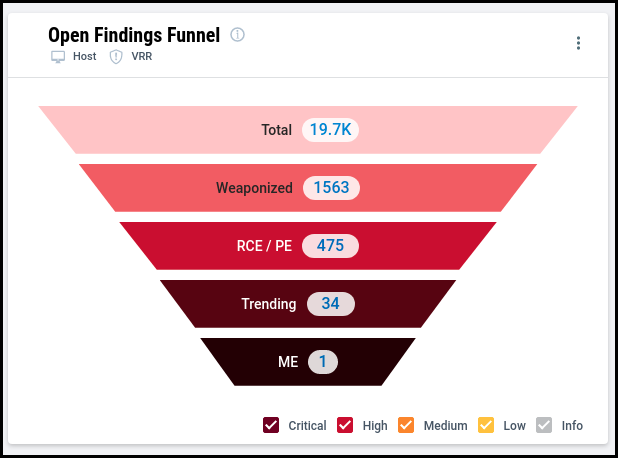
This widget assists with the prioritization of high-risk findings. It shows counts of open findings related to threats in order of increasing risk. You can use the controls to change whether the counts include findings at all risk levels. Categories of findings represented include the following:
-
Total: The number of open findings under selected filters.
-
Weaponized: The number of open findings related to any kind of threat, including, but not limited to, exploits, malware, default credentials, and manual exploits.
-
RCE/PE: The number of open findings related to remote code execution (RCE) or privilege escalation (PE) exploits.
-
Trending: The number of open findings associated with vulnerabilities and threats in active discussion and use in the wild across the last 30 days.
-
ME: The number of open findings associated with a RiskSense-verified Manual Exploit (ME), identified as a catastrophic vulnerability.
Closed Findings Funnel
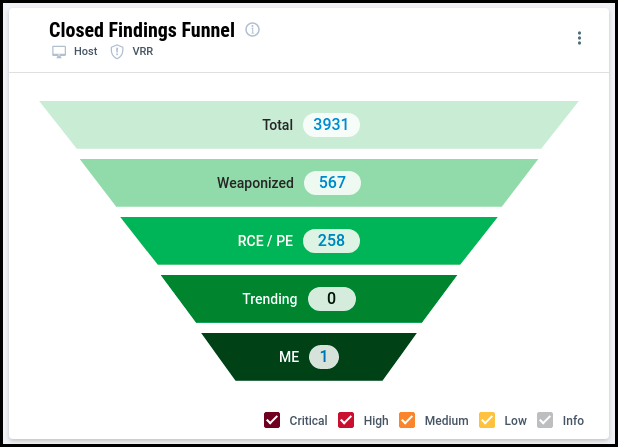
This widget shows counts of closed findings related to threats in order of increasing risk. You can use the controls to change whether the counts include findings at all risk levels. Categories of findings represented include the following:
-
Total: The number of closed findings under selected filters.
-
Weaponized: The number of closed findings related to any kind of threat, including, but not limited to, exploits, malware, default credentials, and manual exploits.
-
RCE/PE: The number of closed findings related to remote code execution (RCE) or privilege escalation (PE) exploits.
-
Trending: The number of closed findings associated with vulnerabilities and threats in active discussion and use in the wild over the last 30 days.
-
ME: The number of closed findings associated with a RiskSense-verified Manual Exploit (ME), identified as a catastrophic vulnerability.
Findings by Address Type
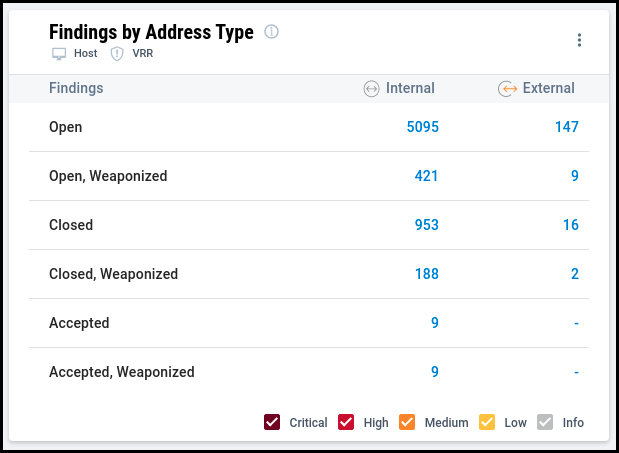
This widget shows open findings, closed findings, and accepted findings grouped by address type. It also shows counts for weaponized open, closed, and accepted findings. Weaponized findings have an association with one or more threats. Your organization can use the widget to compare remediation progress on public, Internet-facing assets in the public range vs. assets on internal networks. You can use the controls at the bottom to change whether the counts include findings at all risk levels.
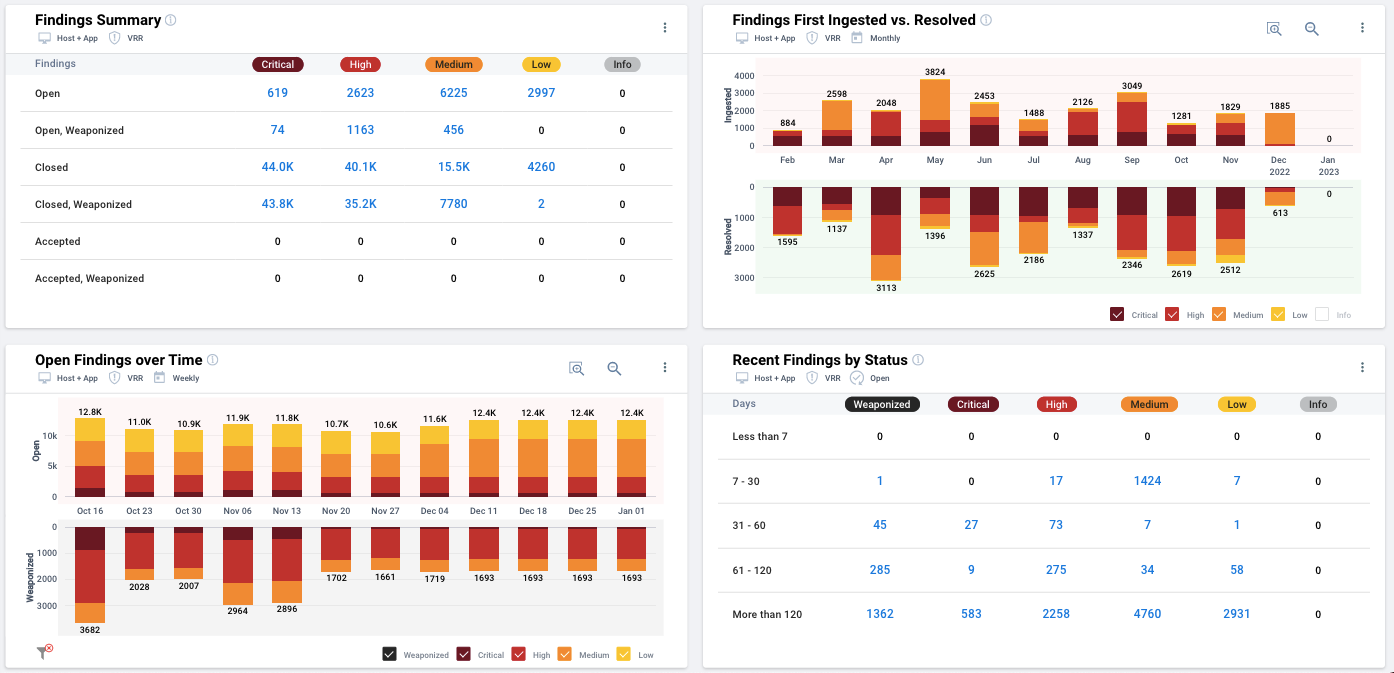
Findings Summary
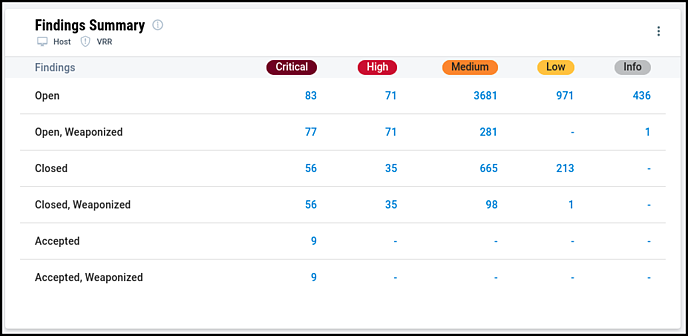
This widget shows a distribution of findings based on remediation status, finding score (VRR or severity), and weaponization (presence of threats). Your organization can use the widget to prioritize findings based on finding score, weaponization, or both.
Findings First Ingested vs. Resolved
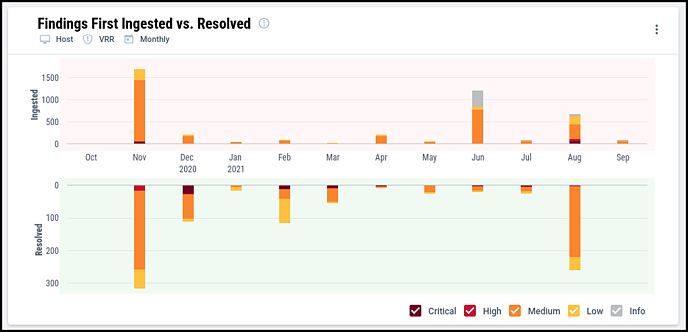
By default, this widget shows the number of findings ingested for the first time vs. the number of findings resolved over a 12 month period (including the current month). The widget also has Daily, Weekly, and Quarterly configurations that show counts for the last 12 days, 12 weeks, or 12 quarters. Each data point also shows a distribution of the findings ingested or resolved by risk level.
Open Findings over Time
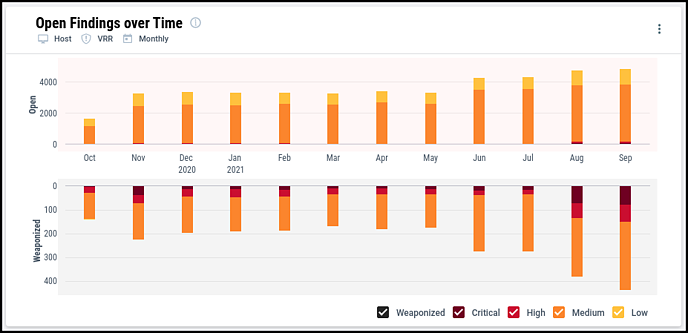
Use this widget to explore how the distribution of open findings and open weaponized findings on your hosts or applications change over time. This widget presents a history of open and open weaponized critical, high, medium, and low findings present on assets.
By default, the widget shows counts of host findings open within the past 12 months. You can also change the time scale for the widget to see counts for the past 12 days or the past 12 weeks. In Weekly mode, the widget shows the number of findings open at the end of the week (Saturday). In Monthly mode, the widget shows the number of findings open at the end of the month.
This widget supports filters on the network name, group name, and tags applied to assets.
Recent Findings by Status
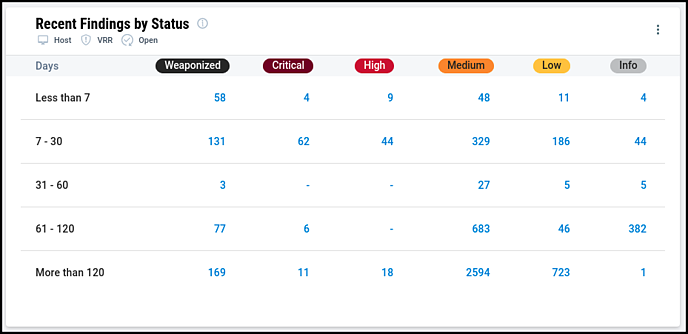
Depending on the widget’s configuration, it shows either open findings distributed by time since first ingestion or closed findings distributed by time since resolution. In either mode, the widget shows the count of weaponized findings in each age range and a breakdown of findings by either VRR or Severity.