Ransomware Dashboard: Overview
Summary: High-level overview of the Ransomware Dashboard.
The Ransomware Dashboard quickly reveals an organization’s exposure to the specific vulnerabilities that are being exploited to launch ransomware attacks, allowing organizations to go on the offensive to fix vulnerabilities that permit ransomware attacks.
The Ransomware Dashboard shows what assets contain vulnerabilities used by ransomware families. The informative risk-based funnel highlights the vulnerabilities that contain dangerous RCE/PE capabilities, as well as those trending vulnerabilities that should be prioritized for immediate remediation.
It enables security leaders to easily and consistently report on what is being done to identify and mitigate the threat of ransomware without using precious security resources to manually perform the laborious task.
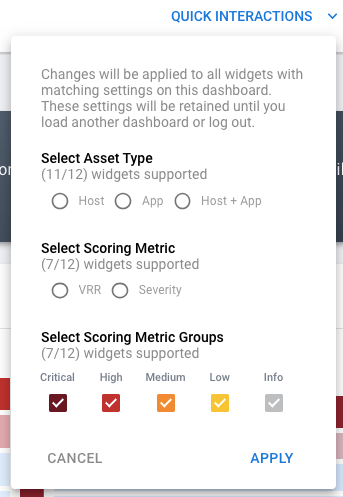
The Ransomware Dashboard has a Quick Interactions that allows users to quickly concentrate on specific areas of interest. They can quickly configure the dashboard to view data for one type of asset or switch the scoring metric for findings between VRR and Severity. Users can also quickly remove lower-risk findings by configuring whether dashboard widgets show Critical, High, Medium, Low, or Info findings. This dashboard also filters by network, group name, and tag.
Quick Interactions
The Quick Interactions menu allows you to set the Asset Type, Scoring Metric, and Scoring Metric Groups settings for the entire dashboard. This menu shows the number of widgets on the dashboard that support each setting. To change widget configurations, click Apply.
Widgets
This section provides detailed descriptions of the KPIs and widgets on the Ransomware Dashboard. Most widgets support these three settings:
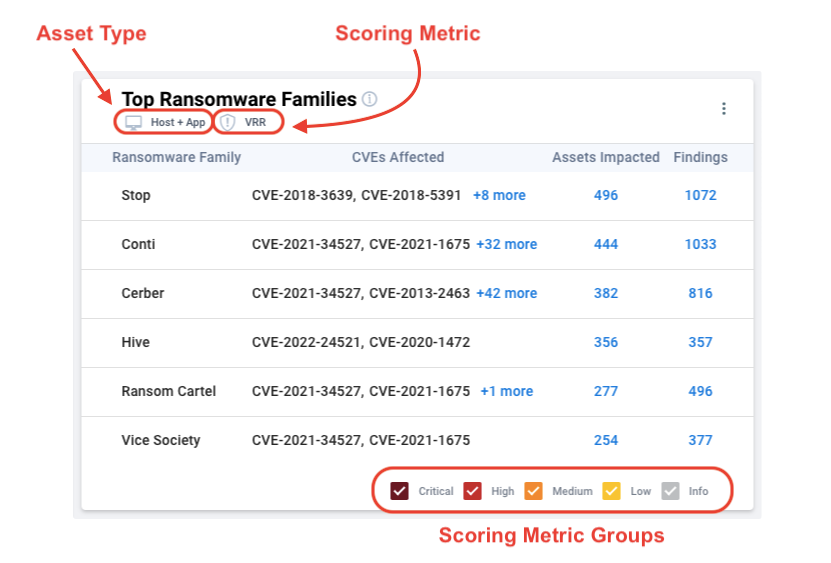
- Asset Type: This setting determines whether the widget shows host data, application data, or both.
- Scoring Metric: This setting determines whether the widget uses VRR or Severity to define risk.
- Scoring Metric Groups: By unchecking specific groups, users can look at data correlating specifically with either high-risk or low-risk vulnerabilities. Some users prefer to remove Info findings from results.
KPIs
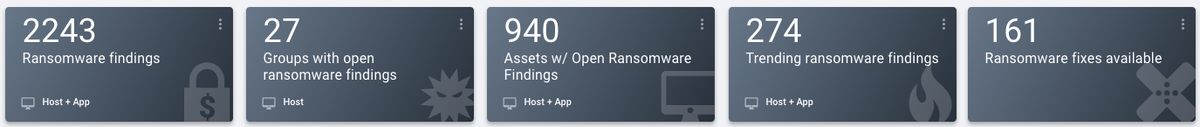
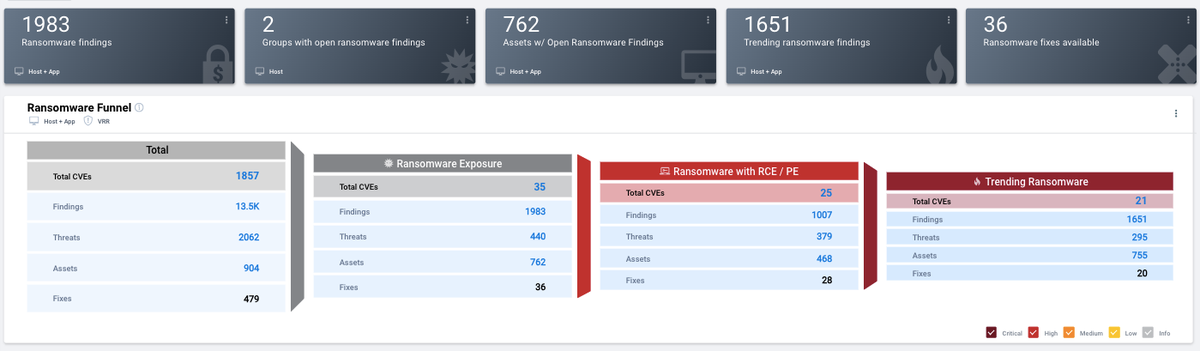
The default KPIs include
Ransomware findings: The total number of open findings associated with ransomware
Groups with open ransomware findings: The number of asset groups with ransomware exposure
Assets w/ open ransomware findings: The number of assets known to be vulnerable to ransomware
Trending ransomware findings: The number of open findings associated either to trending ransomware threats or CVEs
Ransomware fixes available: The number of patches available for open ransomware vulnerabilities
Ransomware Funnel
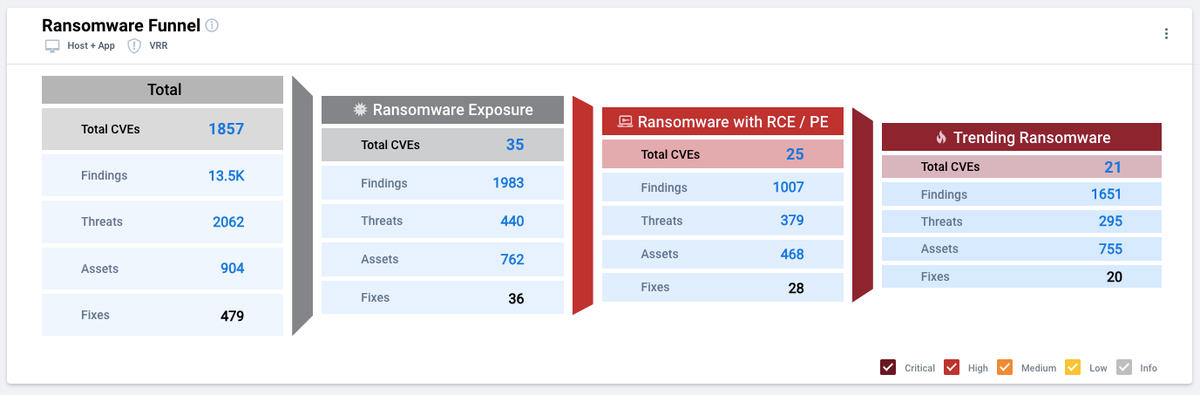
This widget shows the organization’s overall ransomware exposure and places ransomware threat in context with other types of serious exploits. From left to right, the funnel shows metrics for
- open vulnerabilities
- open vulnerabilities related to ransomware
- open vulnerabilities that can be exploited with remote code execution or privilege escalation exploits and that have also been linked to ransomware
- trending open vulnerabilities linked to ransomware
From top to bottom, each section of the funnel shows
- the count of CVEs that meet the criteria for each section
- the count of open findings associated with those CVEs
- the count of threats associated with those vulnerabilities
- the number of impacted assets
- the number of fixes available
Note that you cannot click counts of fixes.
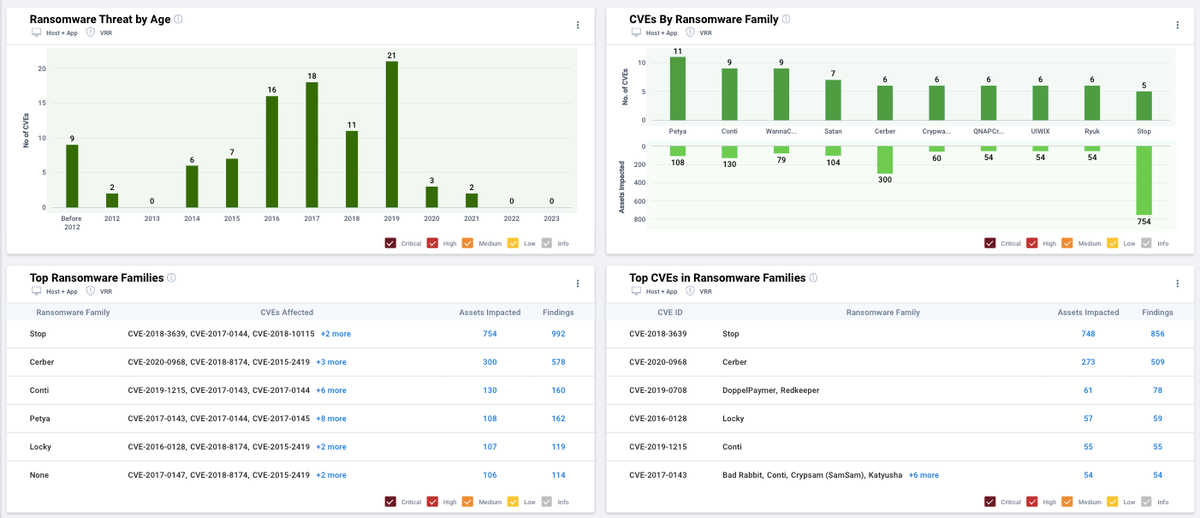
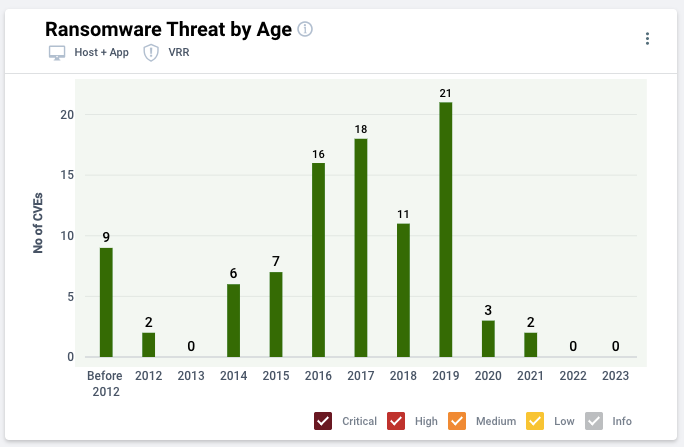
Ransomware Threat by Age
This widget shows the organization’s ransomware exposure by the age of the ransomware (when they were discovered / released). For each year, the widget also shows the number of CVEs associated with ransomware discovered in that year.
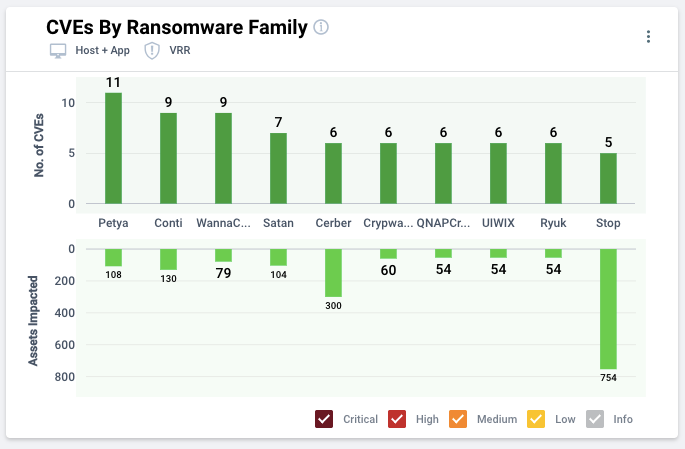
CVEs by Ransomware Family
This widget shows counts of ransomware-related CVEs and impacted assets by ransomware family.
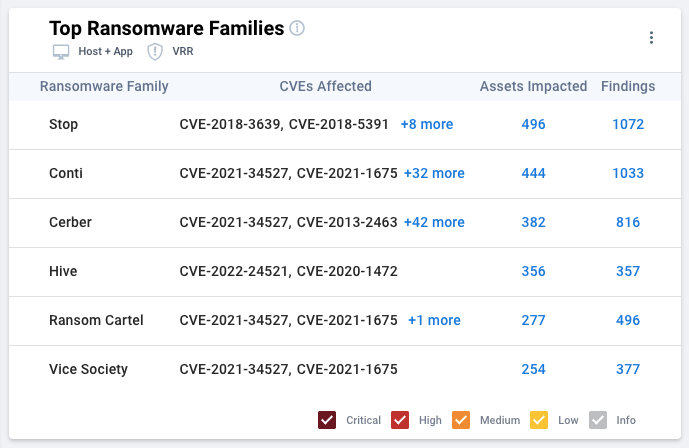
Top Ransomware Families
This widget shows the ransomware families that threaten the most assets. It sorts results by the number of assets impacted. For each ransomware family, the table show also related CVEs as well as the count of associated open findings.
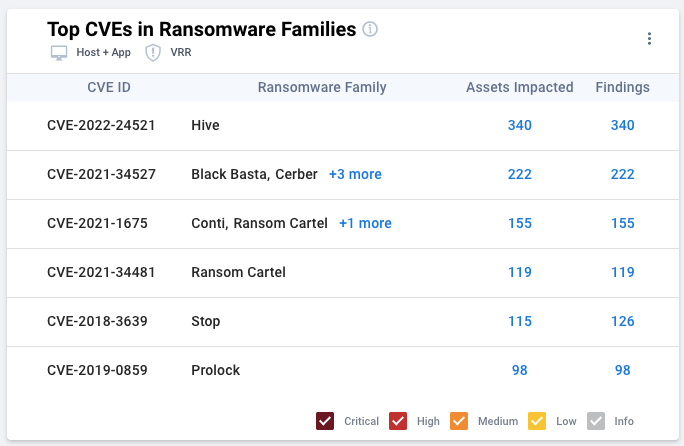
Top CVEs in Ransomware Families
This table shows the top CVEs associated with ransomware threats. The CVEs affect the most assets on your network. For each CVE, the widget lists related ransomware families and the count of open findings.
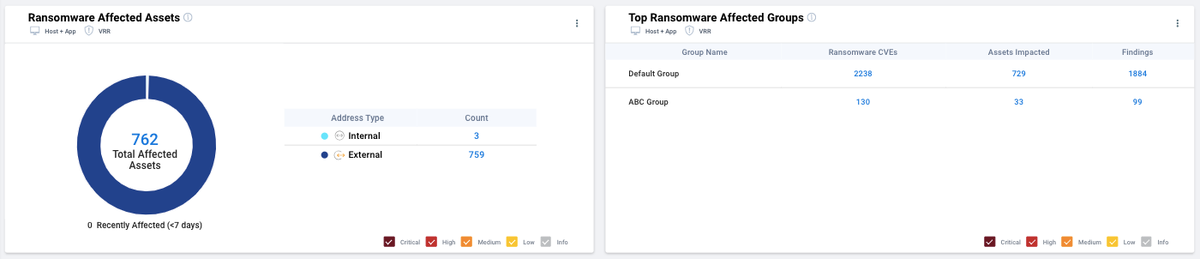
Ransomware Affected Assets
This widget shows the breakdown of assets with ransomware exposure by network location. While internal assets should only be accessible from inside the organization, attackers can potentially exploit external assets without gaining access to internal networks. When users interact with this widget, they can configure a Timeline setting for recently affected assets. The number of recently affected assets corresponds to the number of vulnerable assets recently ingested within the configured time frame.

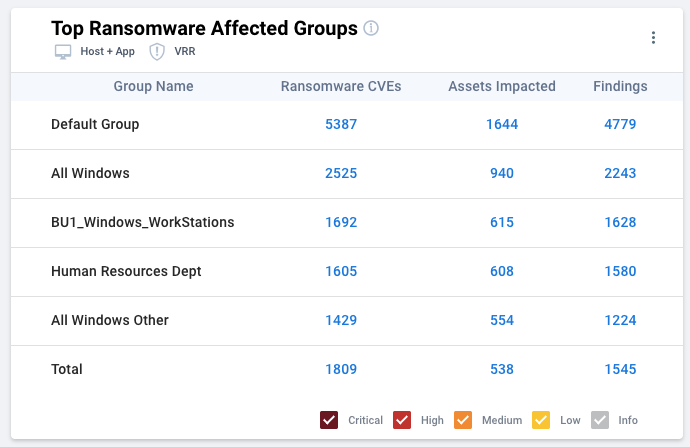
Top Ransomware Affected Groups
This widget shows the asset groups with the highest numbers of vulnerabilities known to be exploited by ransomware. For each group, the widget also shows the number of impacted assets and the number of open findings associated with ransomware. You cannot filter this widget by group name.