Customizing the Column Headers
Show Me!
A video tutorial is available on this topic. To access the video, click the following link:
Watch a related video 04:41)
Overview Information
You can easily customize the way information is displayed within any of the panes in Machine View or Scan View.
- You can reorder the columns by clicking and dragging the column headers to new locations.
For example, if you want missing patch information to be displayed in the first column of the top pane, simply click on the Missing Patch Count icon and drag it to the first column.
TIP: When reordering columns, the column header you are moving will always be placed in front of the column you drag it to.
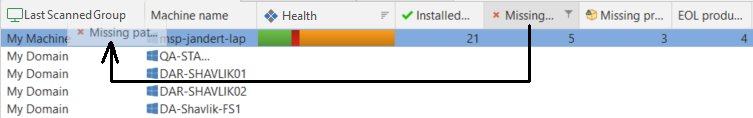
- You can apply filters to one or more column headers.
Hover over a column header and then click the filter icon located in the upper-right corner. For example:

Use the filter menu to select which of the values currently contained in the column should be displayed. When you apply a column filter, the filter definition will be displayed beneath the pane. You can use this to confirm which column filters have been applied to the current display, and you can edit the filter. For example:

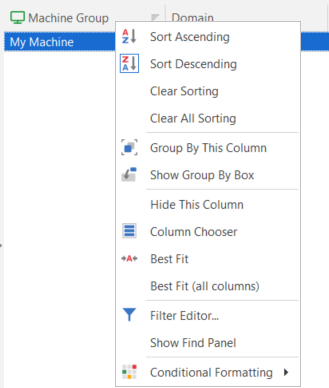
- You can right-click within a column header and perform a number of additional actions.
|
Sort Ascending
|
Sorts the selected column in ascending order.
|
|
Sort Descending
|
Sorts the selected column in descending order.
|
|
Clear Sorting
|
Clears the ascending or descending sorting criteria currently set for a column.
|
|
Group By This Column
|
Groups the table using the data in the selected column. It does this by moving the data into expandable lists that are located in the body of the grid. One expandable list will be created for each possible column value.
If you perform this action on any subsequent columns, that data will be presented as nested groups at increasingly lower levels within the expandable lists.
If Show Group By Box is enabled, this will also create a "Group By" box in the area immediately above the column headers.
TIP: To turn off the Group By This Column feature and revert to the original view: Enable Show Group By Box, drag the Group By boxes back to the column header and then right-click in the column header and select Hide Group By Box.
|
|
Show Group By Box / Hide Group By Box
|
Displays or hides an area immediately above the column headers that contains "Group By" boxes. One "Group By" box will be displayed for each column header for which Group By This Column is currently enabled. You can also drag column headers to and from this area.
The table will be grouped according to the data in the box. If there are two or more boxes then the grouping will be nested, with the left-most box presented at the highest level, the second box presented at the second level, etc.
|
|
Hide This Column
|
Removes the column from the table. You can add the column back to the table using the Column Chooser.
|
|
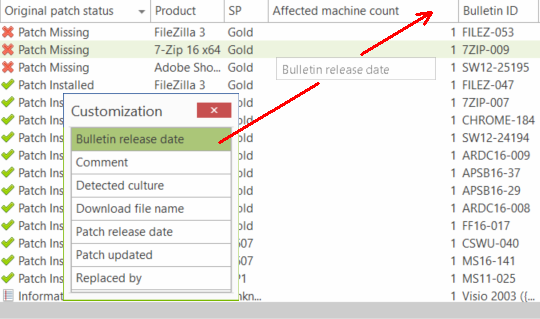
Column Chooser
|
Enables you to add and hide information within a pane. When you select Column Chooser the Customization dialog is displayed. This dialog is used to store the columns you don't currently want displayed within the pane. Simply click and drag the desired column headers from the table to the Customization dialog. For example, if you decide you want to add the Bulletin release date column to the table, simply drag that column header from the Customization dialog to the table.
If you decide you want an item back in the table, simply click and drag it from the Customization dialog back to the table.
|
|
Best Fit
|
Resize the width of the selected column so that the header text is displayed in the optimal amount of space.
|
|
Best Fit (all columns)
|
Resizing the width of all columns in the table so that the header text is displayed in the optimal amount of space.
|
|
File Editor
|
The Filter Editor dialog will show any filters that are currently active in the column headers. You can use the editor to modify the existing filter criteria and to build new criteria using the available filter conditions and logical operators.
|
|
Conditional Formatting
|
Enables you to highlight information within the table based on criteria that you set.
|