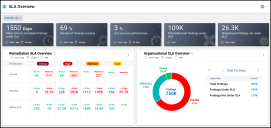
SLA Overview Dashboard
Summary: A high-level overview of the SLA Overview Dashboard.
SLA Dashboard Design Changes
The SLA dashboard introduces a new look and feel for the Dashboards area. If you leave the SLA Overview dashboard, you will see the old Configurable Dashboards page. Within the near future, we plan to migrate all system and custom dashboards to this new layout.
In this new layout, you can find options for creating or copying system dashboards under the Settings menu in the upper right. This layout also has a more flexible filtering interface that lets you disable individual filters or change the polarity of a filter with one click.
Overview
The SLA Overview dashboard focuses on Remediation SLA metrics. You can use this dashboard to evaluate your organization’s success in meeting SLA targets and view upcoming due dates on findings. By default, the dashboard presents a comprehensive picture of SLAs on both hosts and applications. You can configure most widgets to show only SLA metrics for host or application findings.
Some widgets present remediation SLA metrics within the context of potential risk. By viewing findings at each risk level (Critical, High, Medium, Low, and Info), you can prioritize the findings both by risk and by the due date. By default, the dashboard uses VRR as the finding scoring metric. You can configure many of the widgets to use Severity (CVSS) instead.
This dashboard also includes several new group metrics widgets that allow you to compare SLA metrics for individual groups. You can use the group widgets to compare groups with different SLA policies.
Important Terms
The SLA Overview dashboard presents findings based on their current remediation status and their current SLA status:
-
Overdue: An open finding becomes Overdue if it has a due date in the past.
-
Within SLA: An open finding is Within SLA if it has a due date today or in the future.
-
Met SLA: A closed finding has Met SLA if your organization closes it before its due date.
-
Missed SLA: A closed finding has Missed SLA if your organization closes the finding after its due date has passed.
Key Performance Indicators (KPIs)
At the top, the SLA Overview dashboard has six KPIs. These KPIs highlight how many assets have a remediation SLA and how successfully your organization has met SLA targets. Two KPIs, Patchable host findings under SLA and Weaponized findings not under SLA, may assist you with identifying which findings under SLA to prioritize.
|
KPI |
Description |
|---|---|
|
Mean time to remediate findings under SLA |
The average amount of time between ingestion and resolution across findings under SLA. |
|
Percent of findings overdue |
The percentage of findings overdue past a certain number of days, relative to the number of open findings under SLA. |
|
SLA success performance |
The percentage of findings under SLA that Met SLA, divided by the total number of findings under SLA closed in the same time frame. |
|
Patchable host findings under SLA |
The number of open host findings under SLA that have one or more available patches. |
|
Weaponized findings not under SLA |
The number of findings associated with a threat of any kind, which do not currently have any due date set. |
Configurable Widgets
This section focuses on the remaining widgets. Most of these widgets have configurations for Asset Type and Scoring Metric. Asset Type determines whether the widget shows host findings, applications, or both.
Scoring Metric changes whether findings are distributed according to their VRR or Severity (CVSS). Additionally, some widgets have a Timeline configuration that limits the findings shown to those with due dates or resolution dates in the last “X” days.
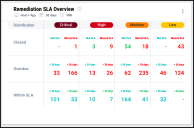
Remediation SLA Overview
This widget displays a set of summary statistics regarding SLAs across your organization. Findings are broken down according to whether they are closed, overdue (open, with a due date in the past), or Within SLA (open, with a due date in the future).
For closed findings, those that met versus missed their set due dates will be displayed. In the Overdue row, counts based on the duration that the findings are overdue will be shown. Within SLA row displays counts of findings due within and outside of the configured time frame.
Configuration options for this widget include Asset Type, Timeline, and Scoring Metric.
Organizational SLA Overview
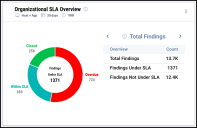
This interactive widget directly compares counts of overdue findings, closed, or within SLA in the time frame configured by the user. By default, the widget shows an overview of these three counts, including a tabular breakdown of findings covered by SLAs and those that have no due dates. The widget also provides additional overviews of Overdue findings, findings Within SLA, and Closed findings that have Missed or Met SLA.
Configuration options for this widget include Asset Type, Timeline, and Scoring Metric.
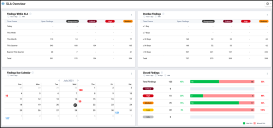
Findings Within SLA
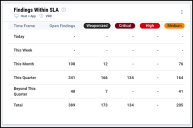
This widget displays the distribution of open findings Within SLA. The widget also shows the number of findings that will become Overdue within the current week, month, or quarter.
The widget also assists with prioritizing open findings by showing the count of open weaponized findings in conjunction with the counts of Critical, High, and Medium findings.
Configuration options for this widget include Asset Type and Scoring Metric.
Overdue Findings
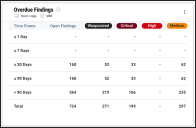
This widget places Overdue findings in the context of risk factors such as weaponization (threats) and the potential severity of open vulnerabilities. It also shows how long high-risk findings have remained open past their due dates. From top to bottom, the widget shows counts of findings due increasingly far back in the past. From left to right, the widget shows the count of open findings, the count of open findings associated with threats, and a breakdown of findings by finding score.
Configuration options for this widget include Asset Type and Scoring Metric.
Findings Due Calendar
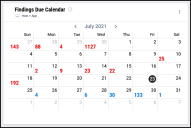
This calendar widget shows the number of open findings coming due on each day of the month. Counts of Overdue findings appear in red. Counts of findings Within SLA appear in blue.
This widget has an Asset Type configuration.
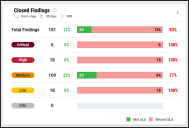
Closed Findings
This widget shows the percentage of closed findings that Met SLA vs. the percentage of closed findings that Missed SLA.
To view percentages for findings resolved within a specific time frame, change the Timeline setting. This widget also has the configurations Asset Type and Scoring Metric.
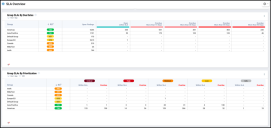
Group SLAs by Prioritization
This widget shows SLA metrics for up to 10 groups. For each group, the widget shows the group's RS3, the total count of open findings, and the breakdown of open findings by risk level and SLA status.
Configuration options for this widget include Asset Type, Scoring Metric, and the group selection mechanism.
Group SLAs by Due Dates
This widget shows SLA finding counts for up to 10 groups. For each group, the widget shows the group’s RS3, the total count of open findings, and a breakdown of open finding counts according to whether the finding is Within SLA or overdue.
You can configure the four Overdue columns to show the count of findings with due dates increasingly far back in the past. At minimum, you can choose to see findings that have been overdue for less than 7 days. At maximum, you can choose to see findings that have been overdue for more than 120 days.
Other configuration options for this widget include Asset Type and the group selection mechanism.
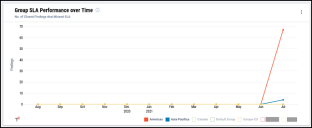
Group SLA Performance over Time
This widget provides timeline metrics for monitoring SLA performance at the group level. You can configure the widget to show one SLA timeline metric for up to 10 groups. Additionally, you can also change the start date, the number of data points shown, and the timeline type to monthly or weekly.
Policy Compliance Overview
The Policy Compliance Overview widget displays the number of host findings that are compliant and non‑compliant across different groups. The information shown is based on the selected specific group.
Viewing the Compliance data
To view the compliance data using Policy Compliance Overview widget, follow the steps below:
-
In the Policy Compliance Overview section, click the vertical ellipsis (three dots). Click Interact.
-
From the Select Scanner list, select the scanner for which you want to view the compliant and non-compliant data.
-
Select the required groups.
-
Click Apply to generate the compliance view.
