Synopsis Black Duck Connector Guide
Summary: How to set up and use the Synopsis Black Duck connector in Ivanti Neurons.
Synopsis Black Duck Connector Overview
The Ivanti Neurons platform provides an API-based connector that integrates with Synopsis Black Duck, which enables customers to bring in their open-source (OSS) findings into Ivanti Neurons to gain visibility of their overall risk due to vulnerabilities in their open-source libraries to enable a simplified and efficient way to manage those vulnerabilities. Ivanti Neurons users can configure the connector to pull scan data from Black Duck on a periodic basis, as well.
Data from Black Duck is ingested as Applications and Application Findings in Ivanti Neurons. Refer to the data mapping section below for details.
Black Duck Overview
Black Duck is a complete, open-source management solution that fully discovers all open source in your code. It can map components to known vulnerabilities and identify license and component quality risks. Black Duck is used to set and enforce open-source policies and integrate open-source management into DevOps environments.
Black Duck helps security and development teams identify and mitigate open-source-related risks across application portfolios. Black Duck:
-
Scans and identifies open-source software throughout your code base.
-
Maps vulnerabilities to your open-source software.
-
Triages vulnerability results and tracks remediation.
-
Monitors for newly disclosed vulnerabilities in your open-source code.
-
Finds and fixes open-source vulnerabilities in applications and containers.
Black Duck Connector Configuration
Black Duck Setup
-
Requires a subscription to Black Duck.
-
Upload projects into Black Duck using Black Duck Synopsis Detect/CLI. The Ivanti Neurons connector pulls this data and categorizes it into applications and their corresponding findings.
Ivanti Neurons Connector Setup
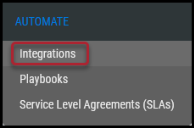
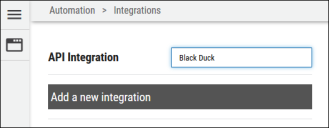
When logged into the platform, navigate to the Automate > Integrations page.
Using the search bar in the upper-right corner of the Integrations page, type Black Duck to find the connector.
Click Configuration in the Black Duck connector card.
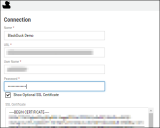
Complete the following required fields. These fields include:
-
Name: Connector name.
-
URL: Black Duck instance URL.
-
User Name and Password: Black Duck user credentials.
-
Network: Network name in Ivanti Neurons. Ingested applications and findings will be associated with this network.
-
SSL: Black Duck SSL certificate.
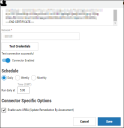
Once the fields have been filled out, click Test Credentials to ensure the connector can connect to the Black Duck instance.
Additional connector configurations, such as Schedule and Connector-Specific Options can be set up here. If required, you can also enable Auto URBA (Update Remediation by Assessment) here, too. Once connector configuration is complete, click the Save button.
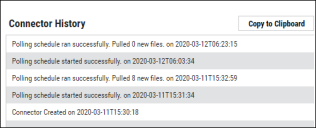
When the connector is set up, a new entry for it appears at the top of the Integrations page. This connector runs once the initial setup is complete. Check the connector’s status by clicking the History button.
In the Upload Center (navigate to the Settings ( ) > Upload page), files pulled from Black Duck are parsed, aggregated, and filtered for displaying data on the Applications/Application Findings pages.
Data Visualization in Ivanti Neurons
The data from a Black Duck scan file is ingested into Ivanti Neurons as Applications and Application Findings. The Scanner Name associated with these scans is BLACKDUCK. Scanner Name can be used as a filter for Applications and Application Findings.
Applications
Asset data extracted from Black Duck scan files is shown on the Applications page. Project and version details are also extracted from the scan file.
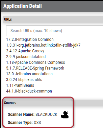
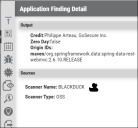
In the Application Detail pane under the Sources section, the scanner is listed as BLACKDUCK.
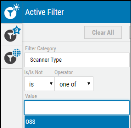
The Scanner Type filter allows you to filter for OSS, SAST (static application security testing), and DAST (dynamic application security testing).
Application Findings
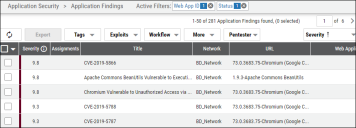
All findings from the Black Duck scan file are shown on the Application Findings page.
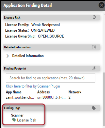
The Finding Type column is available on the Application Findings page. This column provides additional information about each finding, such as OSS, DAST, or SAST.
New filters are also available. These filters allow users to search and aggregate their data.
-
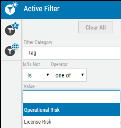
Risk Type: This filter helps segregate the type of risk, such as security, operational, or license, for example.
-
Finding Type: This filter helps segregate the type of finding, such as OSS. DAST or SAST.
License and Operational Risk are system generated as connector tags, which are also filterable. This helps fetch data based on the risk’s nature.
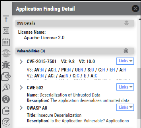
License Name is also available for all findings. The OSS Details icon is available, as well.
This field is filterable, as well. Users can filter all findings, irrespective of security, license, or operational, based on the license name.
New icons are available in the Application Findings Detail pane.
-
License Risk: This icon is displayed only for license risk findings and remains hidden for all other finding types. New columns are available that has license-risk-related information. The addition of the License Risk finding tag helps for filtering findings.
-
Operational Risk: This icon is displayed only for operational risk findings and remains hidden for all other finding types. New columns are available that has operational-risk-related information. The addition of the Operational Risk finding tag helps for filtering findings.
The Application Findings’ Output section has information about the following fields:
-
Credit: Vulnerability contributor details.
-
Zero Day: Boolean value that gives information about a finding’s zero-day attribute.
-
Origin IDs: Source package details.
