Viewing data using the inspector
The Ivanti® Endpoint Manager and Endpoint Security for Endpoint Manager inspector displays details about items in the Ivanti console. Use the inspector to quickly find information about managed devices, groups, queries, security configurations, and many more items.
Inspectors are defined for many standard items. For example, you can inspect managed devices, scheduled tasks, vulnerabilities, and the core server.
User rights required to view the inspector
To view the inspector, a user must have the correct right assigned in Role-based administration. The Inspector right has only one option, View, that can be enabled for a user. If a user doesn't have this right, the Auto inspector and context-menu option for the inspector are not visible.
For information about Role-based administration, see Role-based administration overview.
Opening an inspector window
There are two ways to view data in an inspector window:
- Turn on the Auto inspector (click View > Auto inspect). This opens one window that displays data any time you click on an item. Each time you click another item, that item’s data appears in the Auto inspector window.
- Right-click an item and select Inspect. A new inspector window opens with data for that item.
Inspector windows open separately from the console.
Viewing inspector data
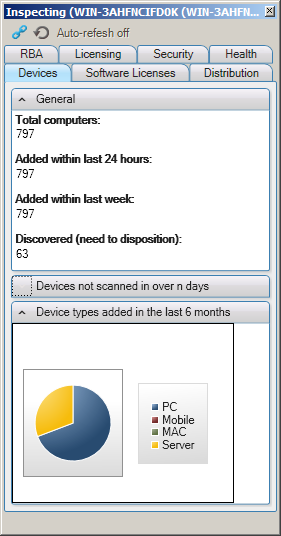
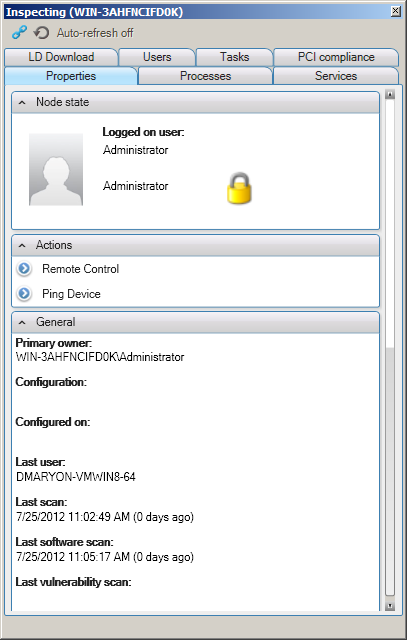
Inspector windows contain different tabs and data. Items are displayed based on the XML file defined for that item. For example, a default inspector is provided for managed devices. When you click a managed device, you see the following tabs in the inspector window:
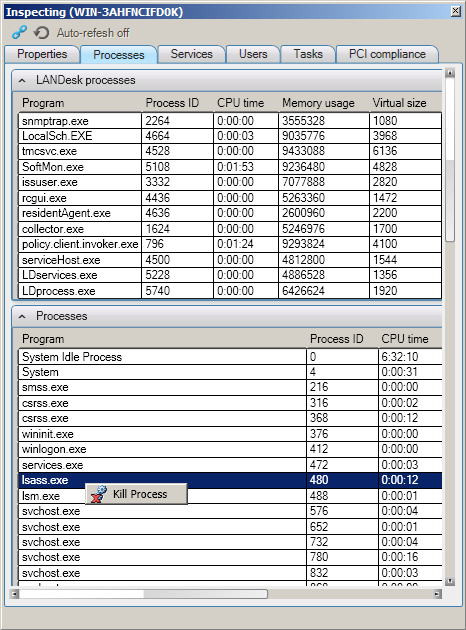
You can resize the window to view data. You can act on some items, such as the list of processes running on a managed device. From the inspector window, you can click the Processes tab, right-click a process in the list, and kill the process.
Similarly, you can stop or start services running on a device by clicking the Services tab and right-clicking a service in the list.
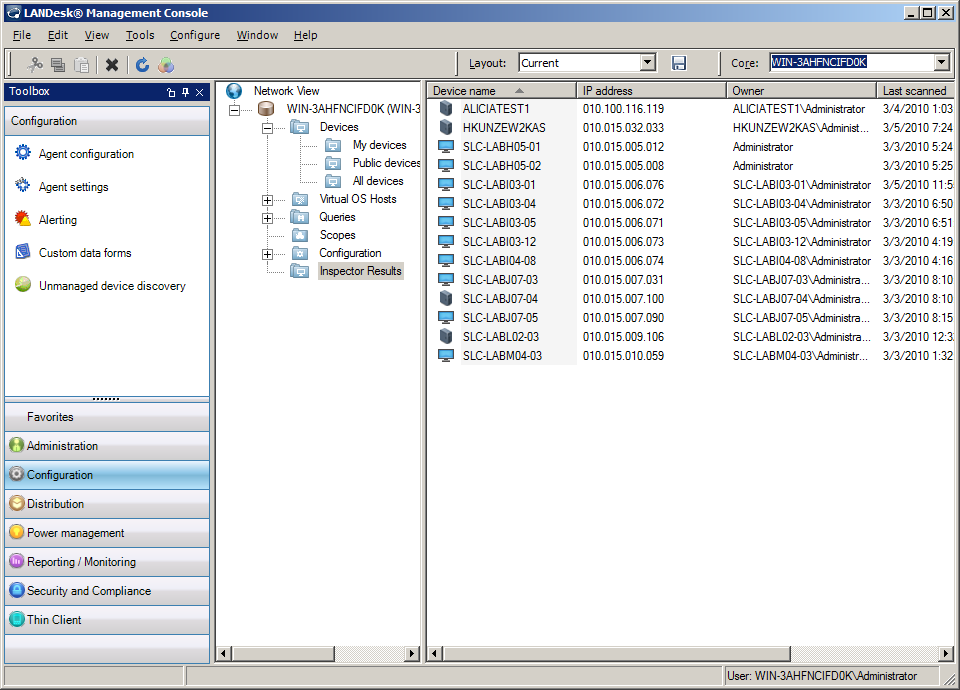
Viewing inspector results
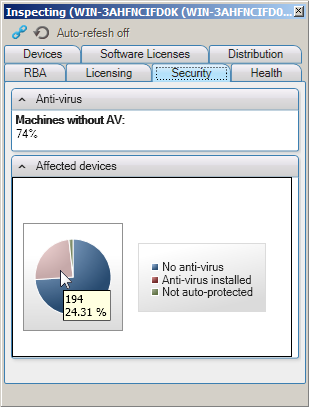
Some data items in an inspector window are displayed as charts. To view the details of a chart, double-click on the chart. The data details are displayed in the network view in the Inspector results list.
Each chart shows a summary of data when you point to a portion of the chart.
Double-click the chart to view the associated data in list format.
Viewing the results this way makes the data actionable. For example, in the Scheduled tasks inspector a chart can show how many devices have failed a task. If you double-click the chart, you’ll see the individual devices listed in the Inspector results folder. You can then apply an action to those devices (such as restarting the task) or view a report with that data to follow up.
Data in the Inspector results folder changes every time you double-click on a chart in an inspector window. In the example above, you would click on the “No anti-virus” section of a chart to see a list of devices without an antivirus application. If you click the “Anti-virus installed” section of the chart, the list changes to display devices with an antivirus application.
Real-time data in inspectors
Some inspector data can be updated in real time. This can only happen if you have deployed a device agent that includes the Real-time inventory and monitoring component.
To check whether a device has the real-time inventory and monitoring agent
- In the network view, right-click the device and select Properties.
- Click the Agents tab.
Default inspectors
The following predefined inspectors are included when you install the inspector add-on:
- Column sets
- Computer queries
- Console users
- Console user groups
- Core servers
- Delivery methods
- Distribution packages
- Queries
- Roles
- Scheduled tasks
- Scopes
- Scripts
- Teams
- Vulnerabilities
Creating custom inspectors
You can create an XML file that defines inspector parameters for items in the Ivanti Management Console. To do this, you’ll need to be familiar with XML conventions and you’ll need to understand how data is managed in the database your core server uses.
For instructions on creating a custom inspector, see the "Creating a custom inspector" document in the Ivanti Community.
NOTE: Inspector help on the Ivanti User Community
The Ivanti User Community has technical documents and user forums for the inspector. To access the community, go to: https://forums.ivanti.com