Network map
Ivanti® Endpoint Manager 2018.1 introduces a new network map display. You can access it by clicking View > Network Map.
The network map isn't populated by default. You'll need to configure a few things first.
Configure the network map in agent settings and in self-electing subnet services. The network mapping agent setting is enabled by default, but you may want to change the configuration items there.
To configure the network map's agent settings
- Click Tools > Configuration > Agent settings. In the tree, click Agent settings > My agent settings > Client connectivity. Create a new client connectivity setting or edit an existing one.
- Click Self-electing subnet services > Network mapping.
- The default Route target is your core server. Change this if you want a different target.
- The default Frequency of network mapping (in days) is seven. The minimum value is one. Most networks don't change very often, so you generally don't have to set this particularly low.
- Click Save and redeploy the agent setting if necessary.
Even if you decided to leave the network map agent settings at their default values, network mapping is disabled by default in self-electing subnet services.
To enable the network map in self-electing subnet services
- Click Tools > Configuration > Self-electing subnet services > Network mapping.
- Right-click each detected subnet that you want to map and click Enable. When toggling the subnet state, the network map won't update until the affected subnet representative checks in and realizes the state has changed.
The network map uses data from self-electing subnet services. The elected device on each subnet can do a traceroute to the route target you specify. By default this target is the core server, but you may want to use a target on the edge of your network, like a gateway, so the map is oriented around that. It's also possible to create and deploy different client connectivity agent settings that each point to a different route target. If you do this, in the network map you can select which target route map you want to view in the Target drop-down list.
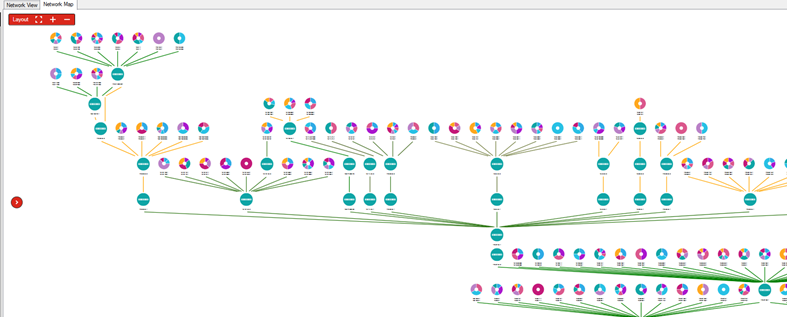
The console coalesces the traceroute data and draws a map of all subnets and intermediate nodes. Each node on the map's top level is a subnet or switch. If there are devices with agents behind those nodes, the node is represented as a color-coded pie chart. The pie chart shows the percentages of different device types behind that node, such as Windows, Apple, and so on. The connection line color indicates the ping response time.
On the network map, you can:
- Hover over a pie chart slice to see the details for that slice.
- Double-click a chart to see the devices on that subnet, along with icons indicating the device type.
- Right-click supported devices to see management options, such as inventory, remote control, and diagnostics.
The network map uses these icons to represent discovered devices:

|
Apple |

|
Mobile |

|
Portable |

|
Server |

|
Switch |

|
Tablet |

|
Virtual guest |

|
Virtual host |

|
Virtual server |

|
Virtual workstation |

|
Windows |