Viewing device diagnostics and logs
Ivanti® Endpoint Manager 9.6 SP1 added a new device diagnostics and logs viewer. You can access it by right-clicking a device and clicking Diagnostics.
The Diagnostics window has the following features:
- Individual client logs (real-time) shown in the log viewer
- Get all client-side logs and upload to core or additional console as a zip file
- View core-side logs
- CSV export of devices
- Real-time PDS ping discovery (mismatches shown in red)
- Inventory
- HTML5 remote control
- Remote event viewer
- Remote file system
- Synchronize policies
- Searching the web for highlighted log content or the current return code
- Searching in any column
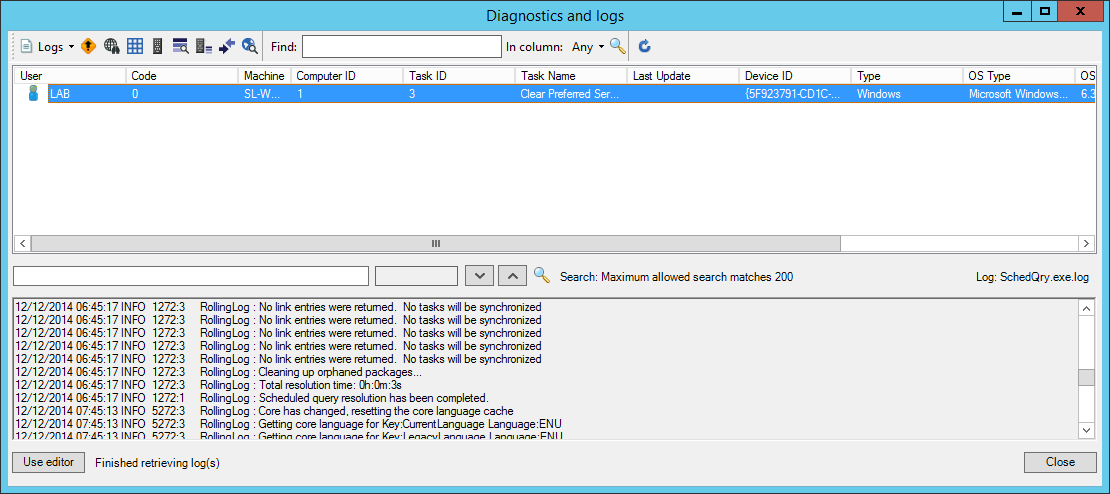
Viewing device logs
The integrated log viewer has the following features:
- Integrated log viewer (allows up to 50K of log information, option to use an external editor)
- Automatically shows failure log if available for the selected task
- Syntax highlighting
- Searching (max 200 matches)
- View client local scheduler tasks (real time)
- View client task history (real time)
- View client inventory change history (real time)
- Option to search the web for highlighted text
- Auto scroll to end of the log
You can view the following client logs:
- Agent install
- AV (install, Ldav, Ldav_scan, and Ldav_update)
- Current downloads
- Gather products
- Local scheduler
- Policy sync
- Proxy host
- Service host
- Reboot
- Software installer (sdclient)
- Status dialog
- Vulnerability scanner (vulscan)
You can view the following core logs:
- Console
- LDAP (schedldapresolver)
- Policy task handler
- Provisioning
- Queries (schedquery)
- Vulnerability core