View detected vulnerabilities
If the security scanner discovers any of the selected definitions on target devices, this information is reported to the core server. To delete the latest scan results from the core for a device, use the instructions below for viewing vulnerabilities by device and then click Clear scan/repair status.
Use one of the following methods to view detected vulnerabilities after running a scan:
In the Patch and Compliance tool window, select the Scan > Detected folder to view a complete listing of all definitions detected by the most recent scan.
The Scanned column indicates how many devices were scanned for a definition, and the Detected column shows how many of those devices are affected by that definition.
You can also view compliance information by group after a Compliance scan by selecting the group and clicking the Computers out of compliance button on the toolbar.
Right-click a definition, and then click Affected computers to view a list of devices on which the definition was detected by the most recent scan.
Right-click a specific device in the network view, and then click Security and Patch > Security and Patch Information to view the results of the latest scan and the patch deployment status for the device.
You can also select multiple devices in the network view, right-click the group, and then click Security and Patch Information to view a list of definitions discovered on one or more of those devices. When you select a definition in the list, the devices on which the definition was detected by the most recent scan display in the bottom pane.
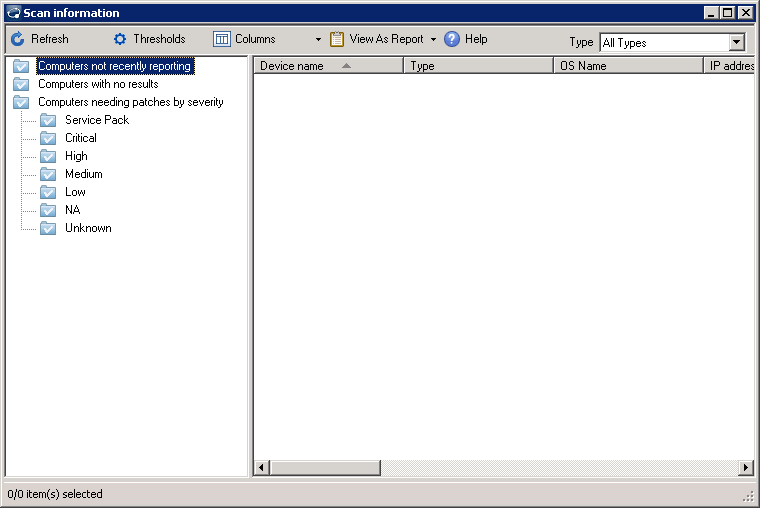
In the Patch and Compliance tool window, click the Scan information toolbar button to view detailed patch deployment activity and status for scanned devices on your network. You can view scan results for devices not recently reporting, devices with no results, and devices needing patches by selected severity type.
You can use the dashboard editor to customize the charts displayed on the main Patch and Compliance page or in the dashboard. Some of the charts available by default show detected definitions by severity, the definitions that have been detected most often, and successfully installed patches.
The security scanner writes a log file for the most recent scan on the device called vulscan.log. These log files record useful information about the time of the scan, language, platform, and the processes run by the scan.