Using reports
The reporting tool can be used to generate detailed reports that provide critical information about the devices on your network. This tool takes advantage of the Endpoint Manager inventory scanning utility, which collects and organizes hardware and software data, in order to produce useful, up-to-date reports.
Several types of reports are available:
- Standard (predefined) reports: Default reports that ship with Endpoint Manager.
- Custom reports: Custom reports that define a unique set of information to generate a report. You can also customize any of the standard reports using the integrated Data Dynamics report designer.
- Ad hoc reports: Automatically generated reports available from various areas of Endpoint Manager. For example, you can right-click a query and click New report to generate a report based on the query.
You can schedule reports so they run at a regular interval. Scheduled reports can be published and saved to a secure file share location on the core server, where anyone with proper login credentials can access and view the reports. You can also schedule the published reports to be e-mailed to designated recipients.
To launch the reporting tool
Click Tools > Reporting / Monitoring > Reports.
To use reports in the Web console
Click Reports under the Reporting group.
Report groups
Open the Reports tool to access predefined reports.
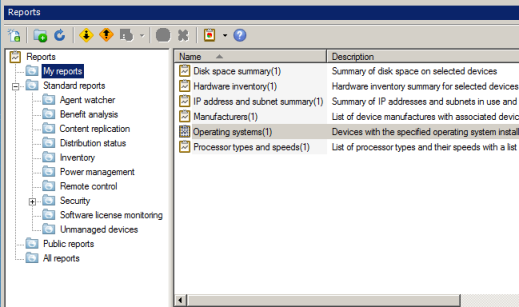
Reports are organized with a tree structure, grouped in the following folders:
- My reports: Reports that the current user has created or copied from another folder. These are typically reports that you run on a regular basis and have organized for your own use. You can organize reports in folders that you create. An administrator has access to each user's reports groups and can add and remove reports.
- Standard reports: Predefined reports that are installed with Endpoint Manager. The reports are preformatted, have query properties and chart types assigned, and are ready to be used.
- Public reports: Custom reports that are made available to all users on the core server.
- All reports: All reports that can be used by the current user. This view includes a Find box that filters the list of reports when you type a search string and select a column. (For example, type "license" and select the "Description" column to view reports related to software licenses.)
Administrators can view the contents of all of the report groups. Users with the Reports right can also see and run reports, as well as publish reports, but only on the devices included in their scope. Users with the Report designer right can create custom reports.
Reports are run against the currently logged-in user's scope and rights. If a user doesn't have permissions to use a tool, that user can't run reports that include that tool. Similarly, the only devices that appear in a report are those included in a user's scope.
Report sources
Predefined reports gather data from the Endpoint Manager database. If you create a custom report, you can specify other available data sources to be included in the report.
Report formats
When running a report, you can save the report using one of the following formats:
- HTML: Standard HTML. You can click charts in HTML reports to view detailed information about an item.
- Image: Bitmap image file
- PDF: Adobe PDF file
- XML: Text file in XML format
- DOC: Microsoft Word
- XLS: Microsoft Excel
When you schedule a report in the Reports tool, you can use the following formats:
- PDF: Adobe PDF file
- XLS: Microsoft Excel
- DOC: Microsoft Word
- CSV: Comma-separated value text file
Additional resources for reports
For more information on using Endpoint Manager and Security reports, see the Ivanti User Community article: Reporting Frequently Asked Questions.