Creating custom reports
The reports tool includes an integrated Data Dynamics report designer that gives you full control over all aspects of reports. In the designer you use page layout elements linked to data objects to display the selected data. You can customize the report appearance, the underlying SQL query statements, the parameters available to users, and so on.
You can create or modify a report by doing one of the following:
- Copy a standard report, paste it into My reports, and edit it.
- Create a query in Endpoint Manager and use that query as the basis for a report.
- Create a completely new report using data sources, parameters, SQL expressions, page layout elements and images.
Report properties
When you create or edit a report, you first specify the report properties.
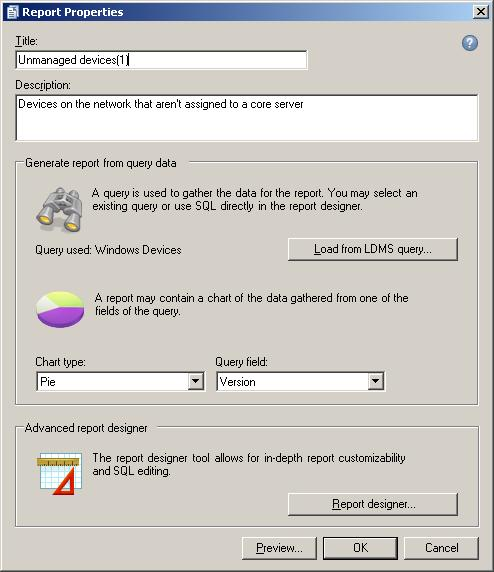
- Title: Type a descriptive title for the report.
- Description: Add any other descriptive information for the report.
- Load from LDMS query: Select a Endpoint Manager query and use it as the basis for a new report.
- Chart type: Select a chart style (pie or bar).
- Query field: Specify which field in the report is represented in the chart.
- Report designer: Open the report designer application to make detailed changes to the report data and layout. (If this button is dimmed, the user doesn't have Report Designer rights.)
- Preview: View the report with the options you have selected in this dialog box.
If you have copied a standard report, you might simply change items in the Properties dialog box and save the new report. But it's more likely that you'll want to open the report designer and make more substantial changes.
Report designer
From the report properties dialog box you can open the report designer. This is a separate application, Data Dynamics Reports, that is integrated with the Reports tool and the database.
NOTE: To open the report designer a user must have the Report designer - Edit right.
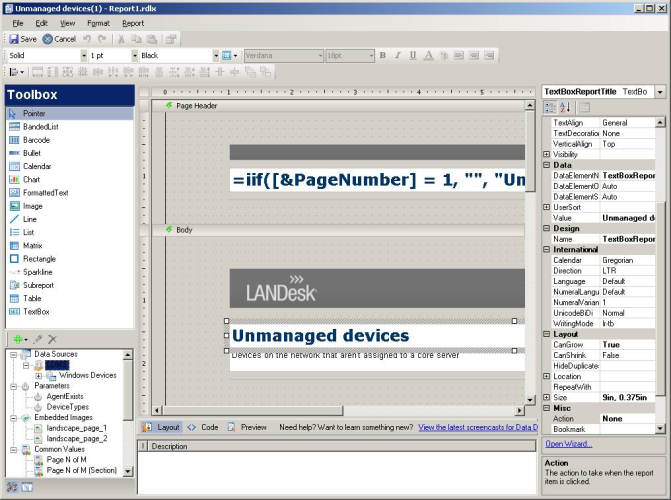
The report designer gives you full access to all aspects of a report.
- Page layout: The center of the designer displays the report's page design. Click the Preview button below the layout to open the report viewer and see how the report will look when you run it.
- Toolbox: Drag a tool onto the page layout to place the object.
- Document outline: View a content outline of the report in the left column (in place of the toolbox).
- Data sources: Specify the data sources you want to use when running the report. Define the source of the data and then add data sets (queries) and parameters that you will use in the report.
- Parameters: Define parameters that determine report results.
- Properties: The right column displays editable properties for the selected object.
- Wizard: Click Open Wizard to view all properties for the selected object, organized by option type.
Basics of creating and editing reports
The report designer is a flexible and feature-rich tool that gives you options for querying and displaying data from a variety of sources. When you create a report, you need the following basic items:
- A data source and defined data sets from which the report is populated
- A page layout to visually display the data
- Data regions and other report items that format the data
Data sources and data sets
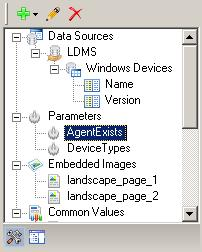
Reports extract information from the data source, a database using a standard format such as SQL, ODBC, Oracle, or XML. In combination with the data source, you define the data sets, queries that are referenced in the report. The data explorer on the left side of the designer shows data sources and data sets in a tree view. In the example below, LDMS is the data source (the Endpoint Manager database) and Windows Devices is a data set. Name and Version are names of fields (database tables) referenced in the data set query.
The Endpoint Manager database appears as a default data source when you create a new report. You can add any other source by specifying a data type, a connection string, and any credentials needed to access the data. This allows data to be extracted not only from the Endpoint Manager database but any other source as well when you create a custom report.
Parameters pass information between data sets. In the report viewer, parameters can be displayed to let the user narrow down the selection of data displayed.
Adding data elements
The report designer includes wizards to help you link to data sources and define data sets and parameters. For example, when you click on a data source (such as LDMS), click the Add button and select Data Set.
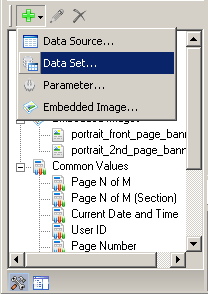
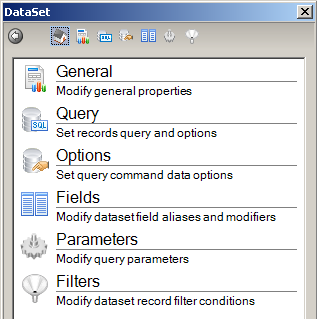
The DataSet wizard is displayed with properties organized in six groups.
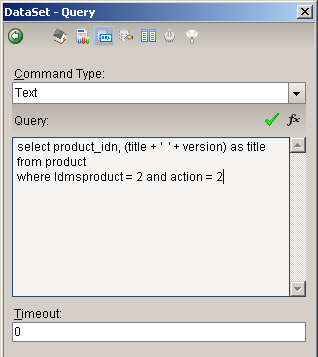
On the Query page of the wizard, for example, you can add a SQL query. Click the green check mark to check syntax, and click the function symbol (fx) to open the expression editor.
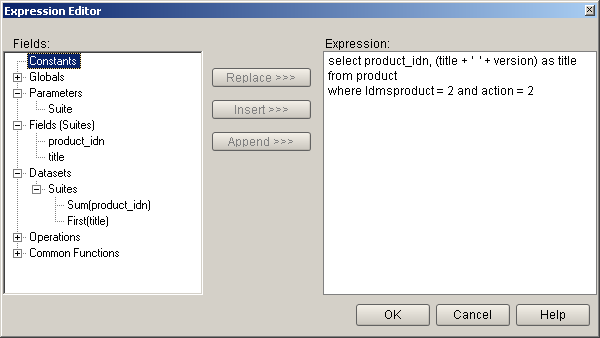
The expression editor lists all fields available for the selected element and lets you insert these items, such as parameters and fields from data sets, into an expression. In addition to the fields related to your data sets, there are commonly used values that are defined globally, and standard operators and functions you can insert into an expression.
After you have added at least one data set, you can define parameters based on your data sets. When a user runs a report, the parameters you add are displayed in the report viewer so the user can select which data will be displayed in the report.
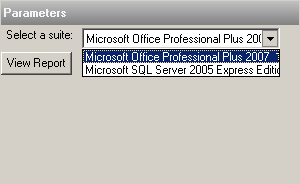
In the following example, the Suites data set has been created, and it references the product table with fields product_idn, title, and version. A parameter called Suite is created. On the General page of the dialog box, the name is added and a prompt text (Select a suite) is specified. This is the prompt that users will see in the report viewer. On the Available values page, values from the query are specified. The value field is product_idn (a unique identifying number from the database) and the label field is title, which means the title (name) of the suite is displayed for the user.

When the report is run, this parameter appears to the user with a list that allows selection of a suite product:
The third page in the Parameters dialog box lets you specify a default selection for the parameter.
Representing parameter selections in a query
When you allow users to select a parameter, you can refer to that selection in a query by using a SQL statement unique to the Data Dynamics report editor: "in (?)". This statement uses the currently selected parameter value as it runs the report. One example of this is shown in the following code sample.
The following query uses fields from the product table and the slm_productsuiteref table to select products that are included in a product suite. In this case, a single product suite is included, identified by its ID number (615).
select p.product_idn, p.title, p.version from slm_productsuiteref r
left outer join product p on p.product_idn = r.product_idn where r.productsuite_idn = 615
order by p.title
Instead of specifying one suite, you can replace the specific product suite reference with "in (?)" to include the suite that the user selects when running the report.
select p.product_idn, p.title, p.version from slm_productsuiteref r
left outer join product p on p.product_idn = r.product_idn where r.productsuite_idn in (?)
order by p.title
You'll find other examples of this usage in some of the standard reports that require the user to select a parameter value.
Layout
Report layouts define page outputs, using standard page sizes. You can specify page size, orientation, a repeated header and footer, and format for the body of the report.
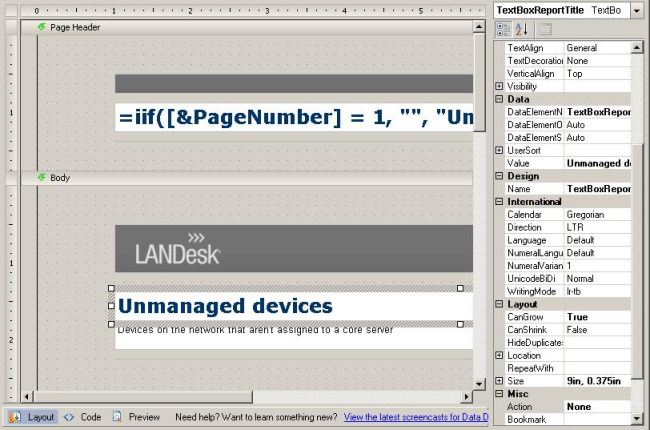
Standard reports use a header with a Ivanti logo that is suppressed on page 1. The body layout begins with a larger logo which only appears once, while data below the logo fills as many pages as needed.
As you work on the page layout, you can quickly add formatting and data region elements by dragging tools from the toolbox.
Drag an item onto the layout, then move and resize it. Define the object in detail by using the properties pane (on the right side of the editor), or click Open Wizard to edit the same properties in a wizard format, with items grouped by property type.
Data regions
Data is formatted using data regions, which are standard format elements defined for specific types of display. Data regions include:
- Table: Rows and columns, with a field from a data set for each column. You can also group rows by a field, such as grouping data by device, where you have a header row for each device and supporting data grouped below the header. (See the Hardware inventory report for an example of grouped rows.)
- List: Items are repeated in a list for every record in the data source. You can use any type of formatting for lists, and for complex groupings you can nest lists or put a list inside another data region.
- Banded list: A collection bands (header, detail, and footer) where data is repeated in the detail band. Banded lists are useful because you can insert elements freely without being constrained by table or list formats.
- Matrix: Also rows and columns, but formatted with both row and column headers, like a cross tab or pivot table.
Data regions are included in the toolbox. They can be combined, nested, and included in any other layout elements.
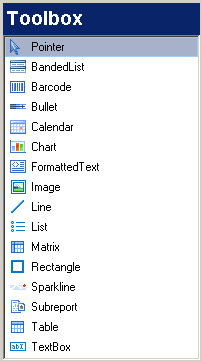
Report items
Items in the toolbox are used to format the page layout and place data on the page.
- Lines are used for visual format.
- Rectangles are a visual element that contains other items.
- Text boxes can be used to place static text or dynamic data anywhere on the page.
- Images can be placed anywhere on the page.
- Charts summarize selected data.
- Barcodes can render data in 23 bar coding styles.
- Sparklines are small charts that summarize data and can be inserted inline into text.
- Calendars can be added to a page and linked to data to display events within a range of dates.
These and other elements are fully customizable and can be combined in many ways to group and display data.
For ideas on how you can define your own reports, view the properties for any standard report and click Report designer to see how the report has been defined.
Additional help
For more detailed help on the report designer, see the Ivanti User Community Web site (https://forums.ivanti.com).