Audit and compliance data in the dashboard
The dashboard pages are designed to give you quick access to useful data that is calculated from your product and license information, such as current summaries of important audit and license-compliance data.
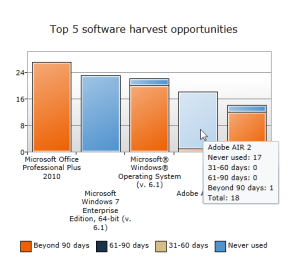
Dashboard pages display report summaries with charts and Advisor data. In the following example, the chart displays the five best opportunities to reclaim (or "harvest") licenses that are not being used. The Advisor box at the bottom of the console shows the total number of installed products that have never been used.

The Advisor section gives you a quick summary of data. Charts show more details, and you can click through sections of a chart to see the details for specific products.
Viewing details of chart data
When you point to a section of the chart, a box shows the data for that section.
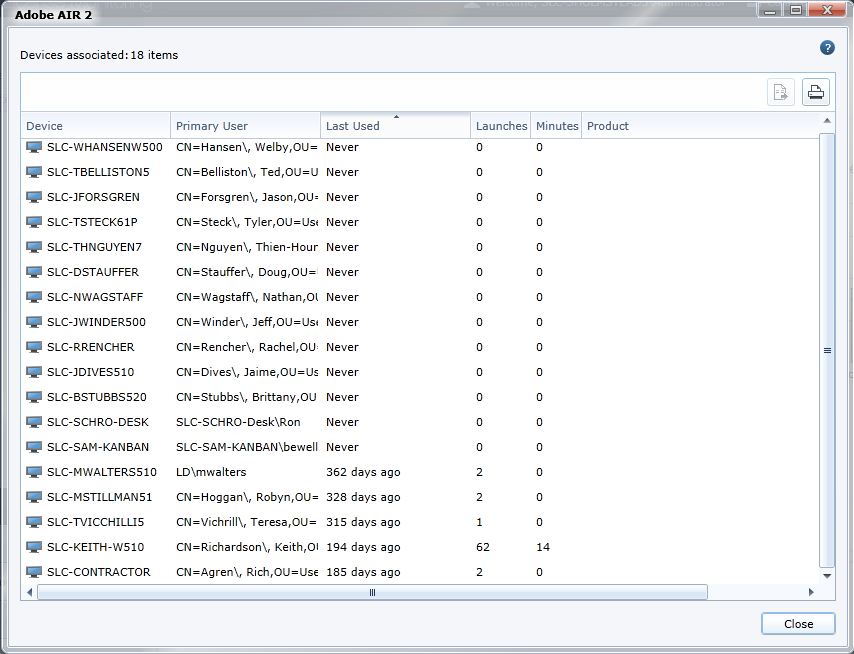
Click a chart section to view a list of related data. For example, when you click a product bar in the harvest opportunities chart, you'll see a list of devices with that product installed.
Viewing details of Advisor data
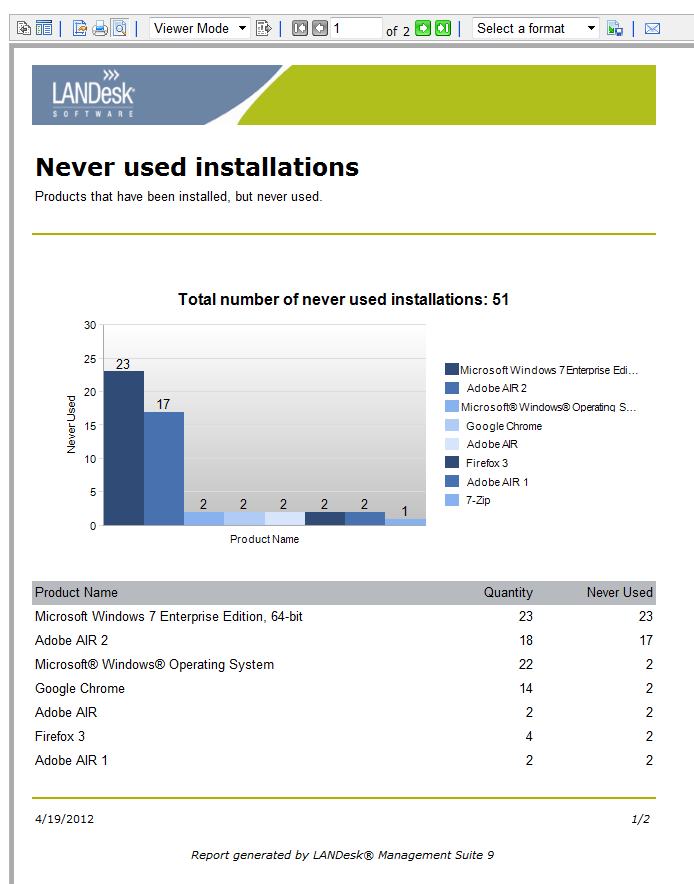
When the Advisor box contains data, click the number to open a full report of the data's source. In the example above, the Advisor reports the number of installations that have never been used. Click the green number to open a report that shows which products are counted in that total.
Exporting data to CSV
When you click a chart to view the detailed data, or any time you are on a product detail page, you can export the data as a CSV file.
To export data in CSV format
- Click a section of a chart.
- In the new window, select the devices that you want to include in the exported data. (Click in the list and press Ctrl+A to select all the devices.)
- Click the Export button
 .
. - Specify the location to save the CSV file in, and then click Save.