Data Summary page: Summary tab
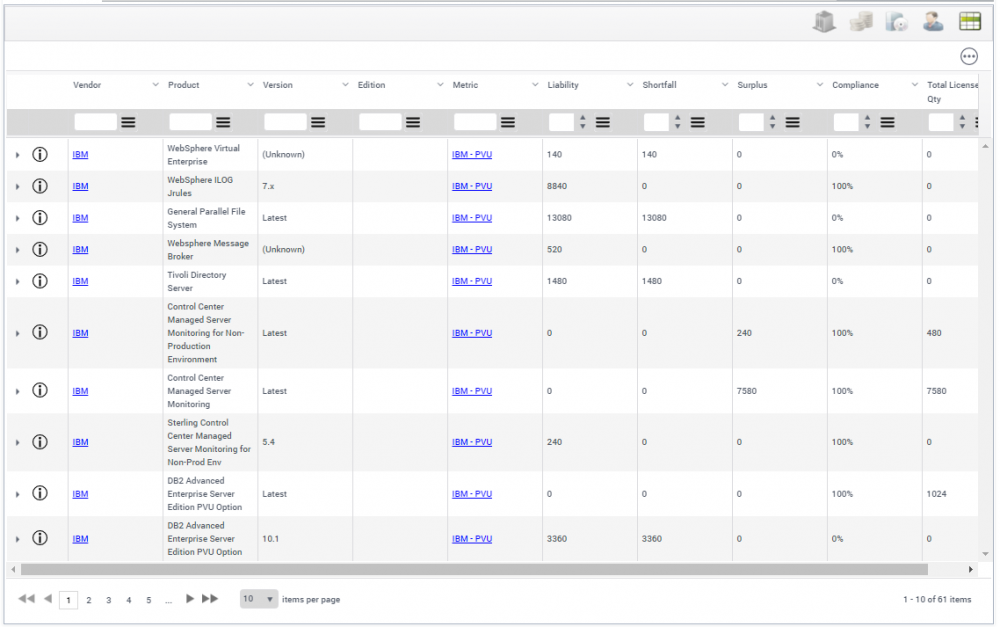
The Summary tab on the Data Summary page contains summary information on the license position:
You can navigate, sort, and filter the data grid, and also export data from it using the data export options in the ![]() menu for each column.
menu for each column.
There are five defined views for the Summary tab with data columns shown that are relevant to the specific view. You switch between the different views using the appropriate icon in the View pick list at the top right of the Summary tab:
![]()
- BU Group view
- Finance view
- Procurement view
- Asset Manager view
- Default view
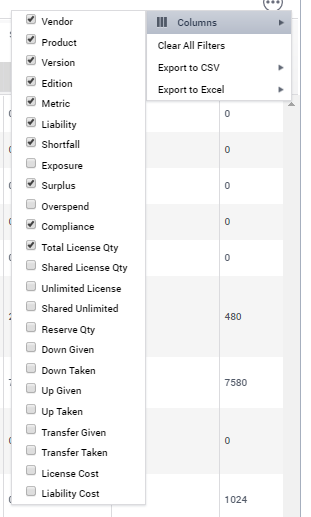
You can define your own view by selecting the columns you want to include from the Columns list on the ![]() menu:
menu:
The columns in the Summary data grid are mostly self-explanatory. However, note the following definitions:
- Liability
The number of units of a product that have been identified from inventory data. - Shortfall
The number of units of liability that could not be covered by valid licenses. - Surplus
The number of units of valid licenses that have not been used to cover liability. - Compliance
The percentage of liability that has been covered by valid licenses. - Total License Quantity
The number of units of valid licenses for the product.
There are a few other unique areas of functionality available on the Summary tab:
- License Movement Details expansion pane
Click the Expand Entry arrow icon to the left of an entry in the Summary data grid to open the License Movement Details expansion pane for the selected entry:
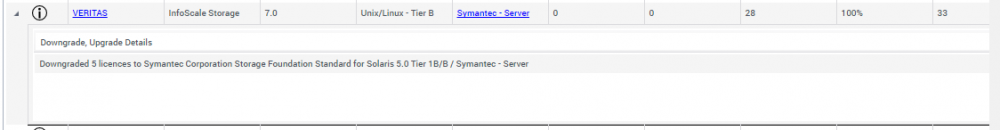
The expansion pane shows any license movement details (such as downgrades, upgrades, or transfers) for the selected entry.
- Assumptions & Recommendations
Click the Information icon to the right of the Expand Entry arrow icon to view any assumptions and recommendations for an entry in the Summary data grid.
- Product Information
Click the required entry in the Summary data grid to display the Product Information dialog, which shows the product name, vendor and metric.
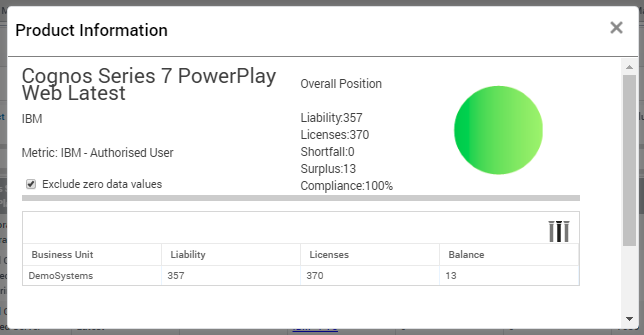
This dialog also shows reconciliation information – Liability, Licenses, Shortfall, Surplus, and Compliance. The compliance is also shown in graphical format as a pie chart.
Below this data, a business unit breakdown of product liability and license usage is displayed. By default, License Optimizer does not show business units that have no liability recorded against them, but you can display the business unit breakdown for these by clearing the Exclude Zero Data Values check box.
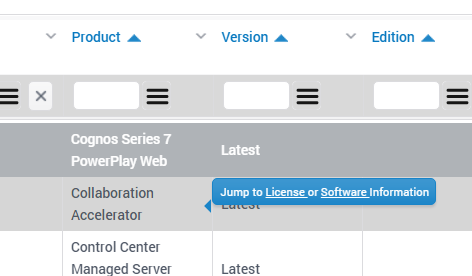
- Jump to License or Software Information
You can open the Licenses page or Software page for an item by holding the mouse over the product column value for a data grid entry, then clicking License or Software.