Viewing System Status
The dashboard offers:
- An overview of the monitored systems.
- A detailed view of each monitored system.
- Sentry charts include:
- Requests Blocked per ServiceType
- HTTP(s) Response Status
- Requests Per ServiceType
- Requests per App
- Request Action Status
- Memory Usage By Process
- Disk Usage
- CPU Usage By Process
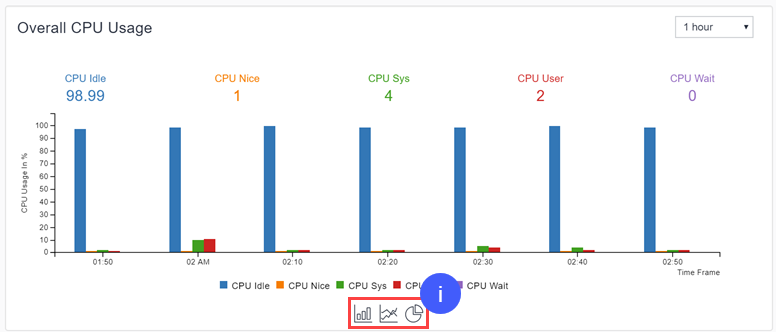
- Overall CPU Usage
- Core charts include:
- Device Retired and Wiped actions
- Top 10 Activities on Core
- HTTP(s) Request status
- Memory Usage By Process
- Disk Usage
- CPU Usage By Process
- Overall CPU Usage
- Self-monitoring charts include:
- Overall CPU Usage
- CPU Usage By Process
- Disk Usage
- Memory Usage By Process
To view the dashboard:
Procedure
-
Click Dashboard:
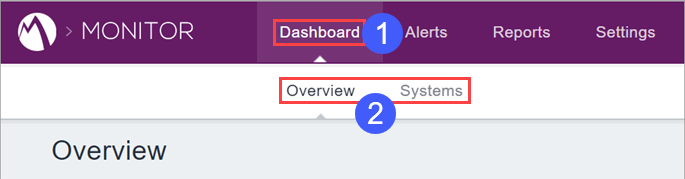
-
Click Overview to view the overview page, or click Systems to view the detail pages.
-
Click the links on the selected page to drill down to more detailed views:
-
Overview page:
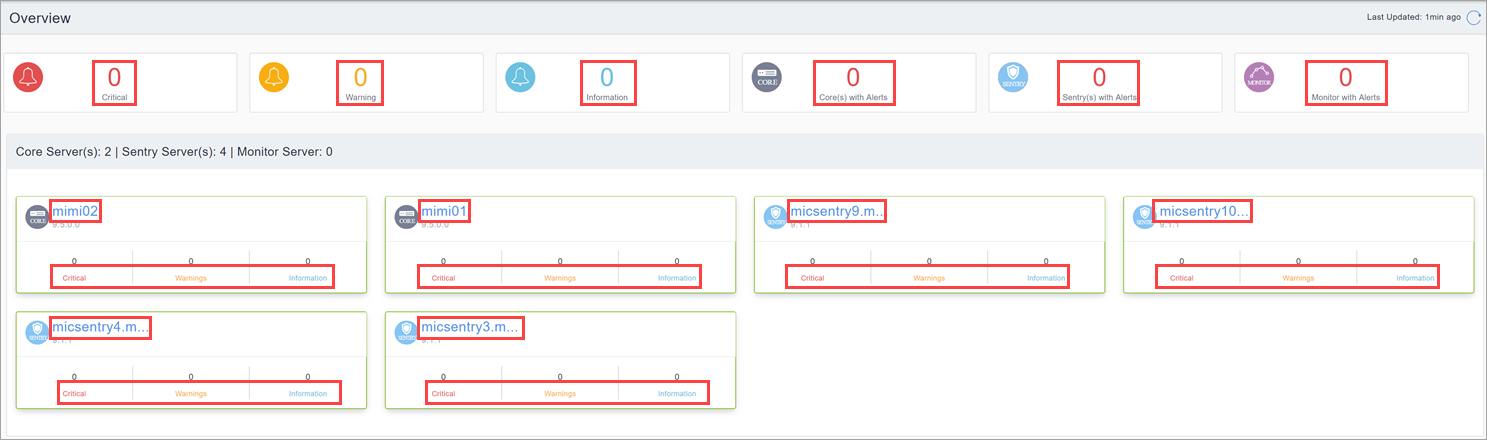
-
Systems page:
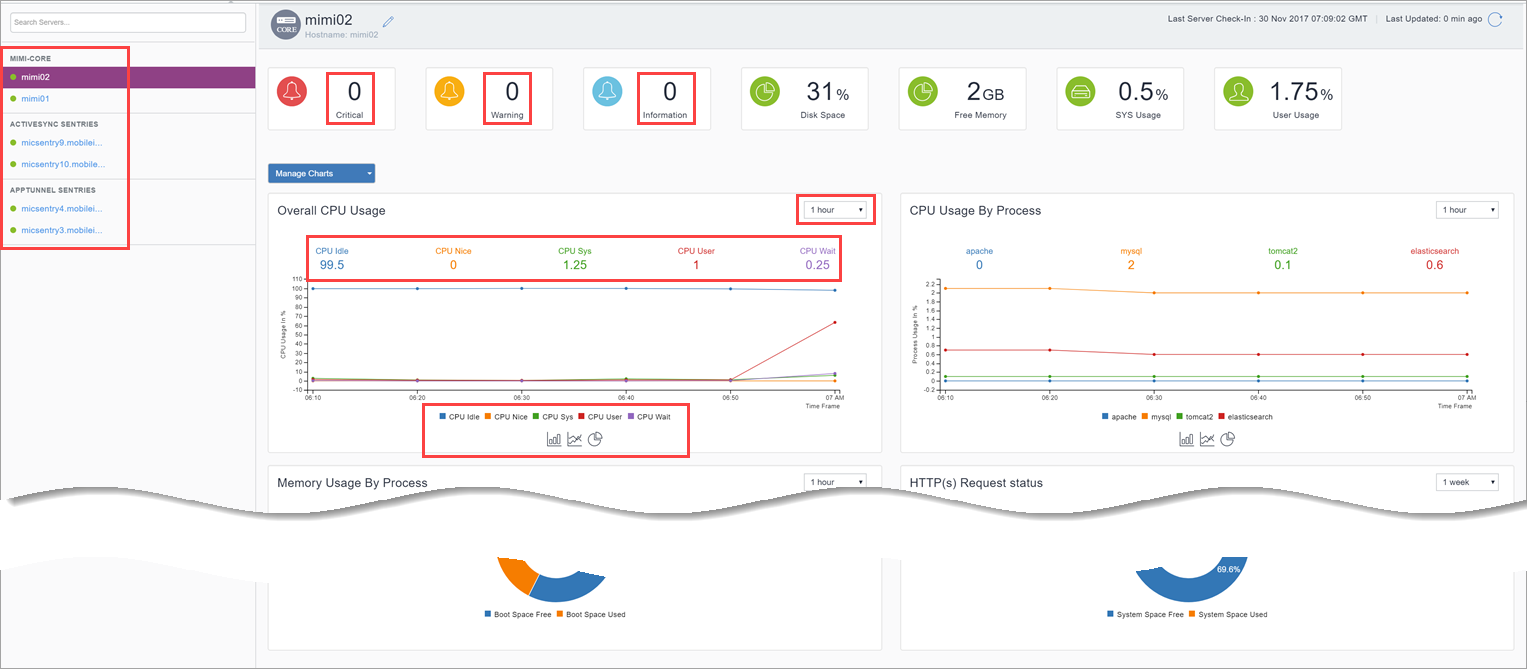
-
Understanding Core high availability servers nomenclature
Monitor can detect and display Cores set up for high availability. Cores configured for high availability appear as <hostname>-primary and <hostname>-secondary.
Creating Friendly Display Names for Host Entries
You can create friendly names for host entries.
Swapping or changing high availability server states from Primary to Secondary or Secondary to Primary will result in erroneous related system details in charts, alerts, and reports.
To create a friendly name for a host entry:
Procedure
-
Click Dashboard.
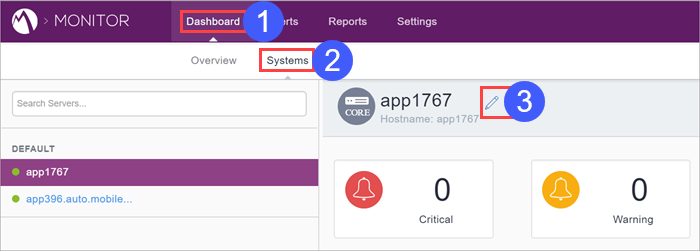
- Click Systems.
- Click the Edit button adjacent to the host name for which to configure a friendly name.
Customizing Chart Display
You can customize which charts display on the Systems page.
To customize chart display:
Procedure
-
Click Dashboard.
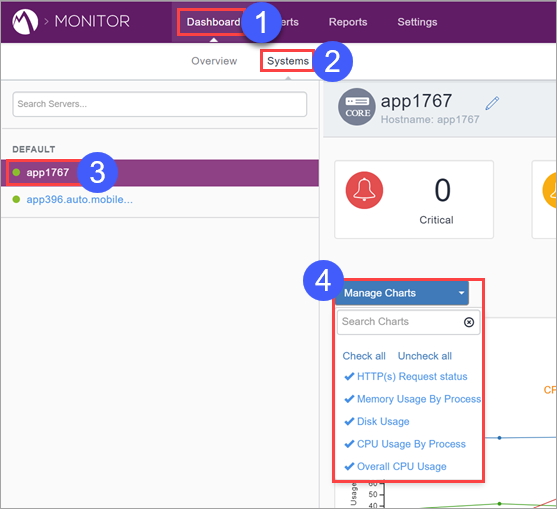
- Click Systems.
- Select the system for which to customize chart display.
- Use the Manage Charts drop-down menu to configure the display.
Toggling Chart Type
You toggle between a bar, line, and pie chart by clicking the respective icons shown below.