Ivanti Access Global Dashboard
The Ivanti Access Global Dashboard is designed to support data management. The dashboard is categorized into sections such as Authenticated Users, Authentication Requests, Secured Cloud Services, Secured Mobile Apps, Authenticated Users & Authentication Requests, Top Secured Services, Top Services By Authenticated Users, Mobile Apps Blocked, and Block & Allow Requests.
You can view the dashboard data for any preferred period. The dashboard displays real time data when the reports are submitted to Ivanti Access by Sentry. It takes about 15 minutes to refresh the data.
You can click on the trend graphs to fetch the overlay card for a preferred date. The overlay card displays the report for the appropriate date you selected. To view the complete report, click View All Data. The Reports tab displays the complete report.

Each data set on the dashboard can be viewed in multiple different graphical formats, such as a bar graph, line graph, pie graph, or in a tabular format. The tabular form also displays the time that the data is aggregated by Coordinated Universal Time (UTC).
|
Sections |
Description |
|
Authenticated Users |
Provides the number of allowed or blocked users that are authenticated by the identity providers. |
|
Authentication Requests |
Provides the number of allowed or blocked requests that are targeting the cloud services. It also provides information about the requests that have processing exceptions. |
|
Secured Cloud Services |
Provides information about Federated Pairs. Each active Federated Pair is a service. |
|
Secured Mobile Apps |
Provides the number of unique applications that are accessed by the user. |
|
Authenticate Registered |
Provides the number of Authenticate registered desktops. It helps the admin view the percentage of desktops they intend to have registered and then accordingly admin can register more desktops. |
|
Authenticated Users & Authentication Requests |
Provides a graphical representation for the authenticated users and requests trends. |
|
Top Secured Services |
Provides the number of blocked requests based on the top secured services. |
|
Top Services By Authenticated Users |
Provides the number of authenticated users for every service. |
|
Mobile Apps Blocked |
Provides a graphical representation about the blocked services. |
|
Allow, Block & Warn Requests |
Provides a graphical representation about the allowed and blocked hits based on any appropriate combination such as Rule, SAML pair, and policies. It also provides information about the warn requests to secured cloud services using specific policies and rules. |
|
Authentication by OS Platforms |
Provides a graphical representation about the Service Provider actions by aggregate OS such as iOS, Android, Windows, Macintosh, Linux, and other unknown platforms. |
|
Authentication by Managed Apps |
Provides a graphical representation about the list of Managed Apps that are accessing the Service Provider. When a managed app that is not available in Ivanti Access database is accessed, a bar named Unknown is displayed in the graph. These apps will be monitored and added to the database in the future releases. |
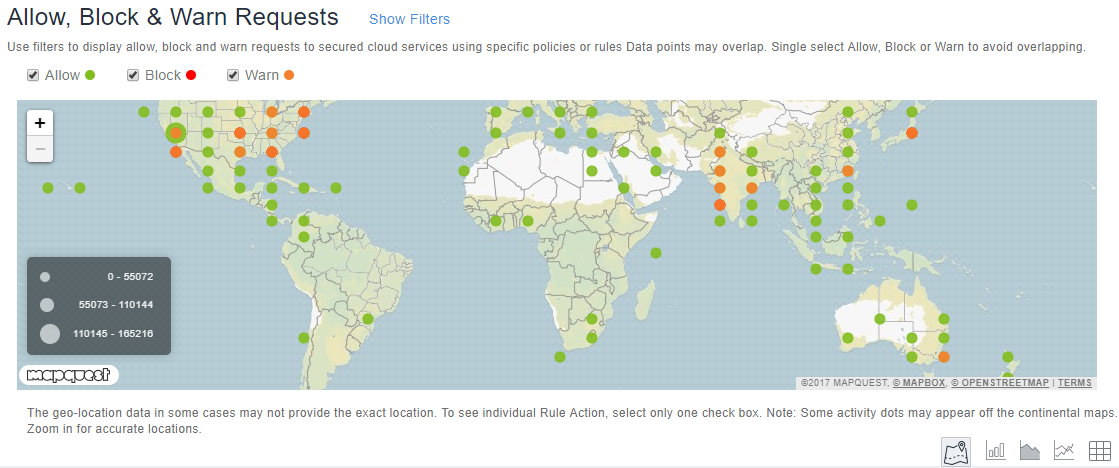
GeoIP Map
The Allow, block, and warn requests data to secured cloud services is available based on geolocation. In the Allow, Block, and Warn Requests section of the dashboard, click  to view geolocation.
GeoIP identifies the location and other characteristics such as over lay card displaying IP address, username, time stamp of end users for a wide range of applications including content personalization, fraud detection, traffic analysis, and compliance. The GeoIP map provides the following features:
•Count of Allow/Block/Warn requests
•Zoom in and Zoom out to have better precision of the data
•Horizontal scrolling to view a particular section of the map
•Filters to narrow down the data set
•Checkboxes to select Allow, Block, or Warn requests
•The geolocation data in some cases may not provide the exact location.
•To see individual Rule Action, select only one check box.
•Some activity dots may appear off the continental maps. Zoom in for accurate locations.
Figure 1. Geolocation for allow, block, and warn requests
Viewing details for allow, block, or warn requests
The Allow, Block, or Warn requests are displayed on the GeoIP map at various locations. You can determine the users logged in from a specific location to assess and mitigate the risks . Clarity is provided through reverse lookup. When you mouse over the Geo bubble, the callout which appears, displays the count of Allow, Block, and Warn requests.
Procedure
| 1. | On the GeoIP map, click the Geo Bubble for Allow, Block, or Warn request. |
The Allow Requests, Block Requests, or Warn Requests window displays based on your selection.
Figure 2. Request details
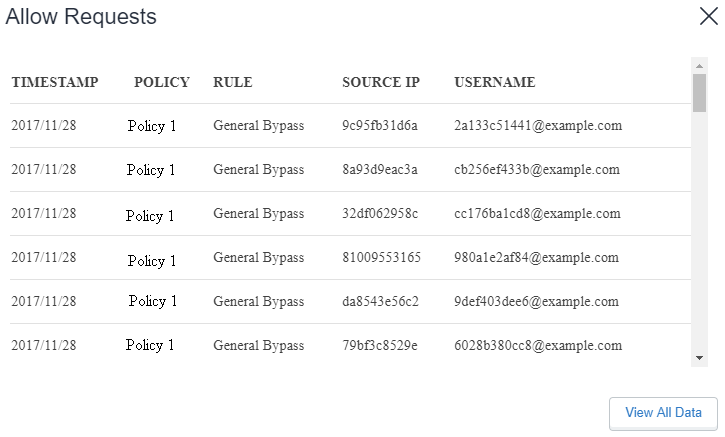
| 2. | Click View All Data. |
The Reports page opens to display the Geolocation details.