Viewing System Status
The dashboard offers:
|
•
|
An overview of the monitored systems. |
|
•
|
A detailed view of each monitored system. |
Sentry charts include:
|
•
|
Requests Blocked per ServiceType |
|
•
|
HTTP(s) Response Status |
|
•
|
Requests Per ServiceType |
|
•
|
Memory Usage By Process |
Core charts include:
|
•
|
Device Retired and Wiped actions |
|
•
|
Top 10 Activities on Core |
|
•
|
Memory Usage By Process |
Self-monitoring charts include:
|
•
|
Memory Usage By Process |
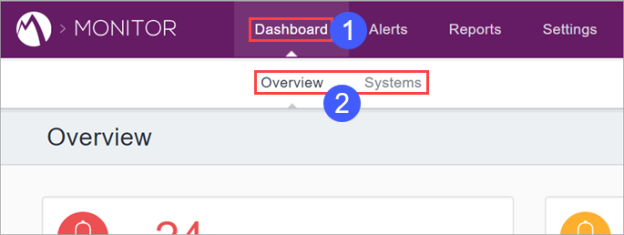
To view the dashboard:
|
1.
|
Click Dashboard:
|
|
2.
|
Click Overview to
view the overview page, or click Systems
to view the detail pages. |
|
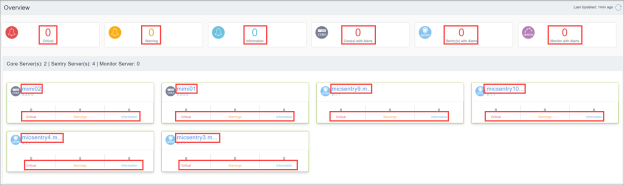
3.
|
Click the links on the selected page to drill down to more detailed
views: |
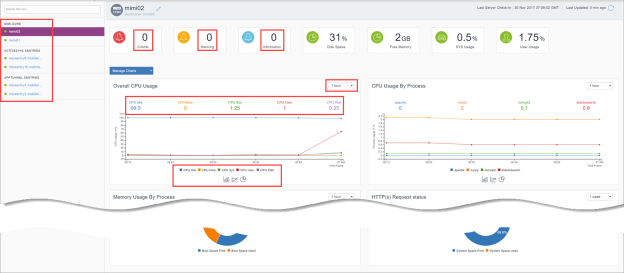
Overview page:
Systems page:
Understanding Core high availability servers nomenclature
MobileIron Monitor can detect and display Cores set up for high availability. Cores configured for high availability appear as <hostname>-primary and <hostname>-secondary.
|
NOTE:
|
Swapping or changing high availability server states from Primary to Secondary or Secondary to Primary will result in erroneous related system details in charts, alerts, and reports. |
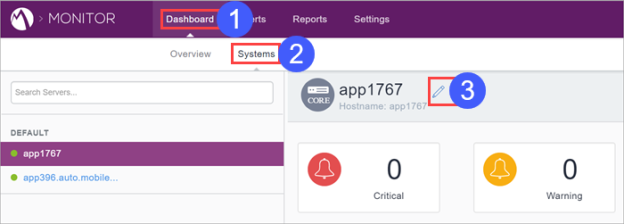
Creating Friendly Display Names for Host Entries
You can create friendly names for host entries.
To create a friendly name for a host entry:
|
1.
|
Click Dashboard.
|
|
3.
|
Click the Edit button adjacent to the host name for which to configure
a friendly name. |
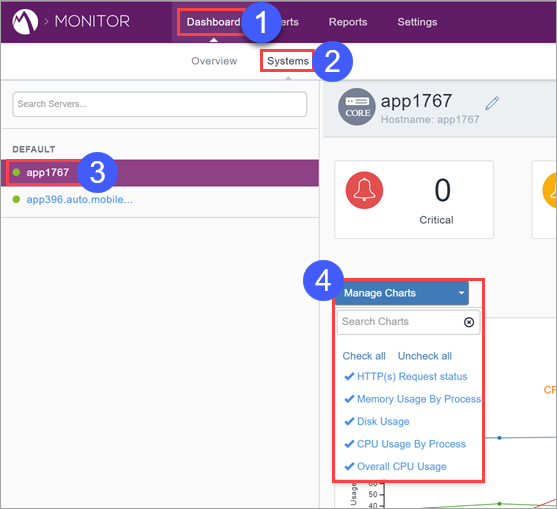
Customizing Chart Display
You can customize which charts display on the Systems page.
To customize chart display:
|
1.
|
Click Dashboard.
|
|
3.
|
Select the system for which to customize chart display. |
|
4.
|
Use the Manage Charts drop-down
menu to configure the display. |
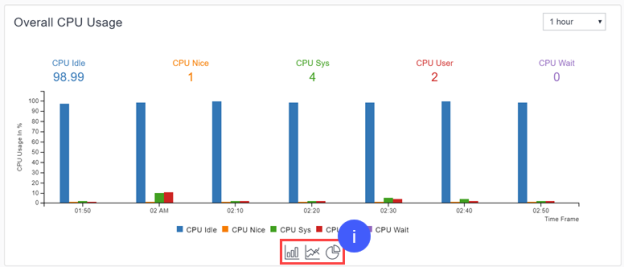
Toggling Chart Type
You toggle between a bar, line, and pie chart by clicking the
respective icons shown below.