ICS Node Monitoring
Ivanti Support representative may ask you to create a snapshot that includes node monitoring statistics to assist with debugging the problem. When you enable the node monitor on the Maintenance > Troubleshooting > Monitoring > Node Monitor tab, the Ivanti Connect Secure captures certain statistics specific to the nodes on your system. Using the snapshot that results, the support team can identify important data, such as network statistics and CPU usage statistics.
Node monitor under Maintenance > Troubleshooting > Monitoring > Node Monitor tab which is enabled by default is NOT related to Monitor all cluster nodes from this node under Group Communication and is not known to cause any system impact.
To enable node monitoring:
1.Enable the node monitor on the Maintenance > Troubleshooting > Monitoring > Node Monitor tab
2.Enter the maximum size for the node monitor log.
3.Enter the interval, in seconds, at which node statistics are to be captured.
4.Select the Node monitoring enabled check box to start monitoring the nodes. This is enabled by default. Ivanti recommends to always enable this option to help in debugging and monitoring system issues.
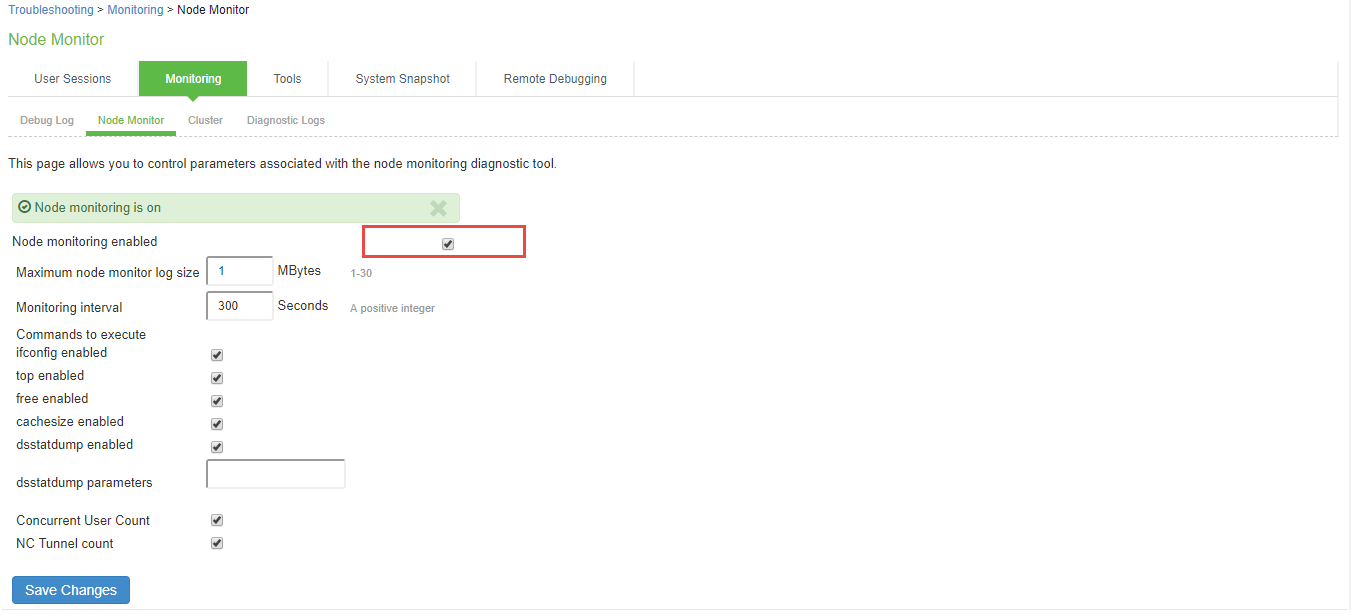
5.For Maximum node monitor log size, enter the maximum size (in MB) of the log file. Valid values are 1-30.
6.Specify the interval (in seconds) that defines how often nodes are to be monitored.
7.Select the commands to use to monitor the node.
If you select dsstatdump, enter its parameters as well.
8.Click Save Changes.
9.If you want to include the node monitoring results in the system snapshot, choose Maintenance > Troubleshooting > System Snapshot, and select the Include debug log check box.
10.Take a system snapshot to retrieve the results.