Using Policy Tracing and Debug Logs
This topic describes the troubleshooting tools available to diagnose issues.
Using Policy Tracing to Troubleshoot Access Issues
It is common to encounter a situation where the system denies a user access to the network or to resources, and the user logs a trouble ticket. You can use the policy tracing utility and log to determine whether the system is working as expected and properly restricting access, or whether the user configuration or policy configuration needs to be updated to enable access in the user's case.
To create a policy trace log:
1.Select Troubleshooting > User Sessions > Policy Tracing to display the configuration page.
2.Specify the username, realm, and source IP address if you know it. If you provide the source IP address, the policy trace log can include events that occur before the user ID is entered into the system.
3.Select the events to trace, typically all but Host Enforcer and IF-MAP, unless you have enabled those features.
4.Click Start Recording.
5.Initiate the action you want to trace, such as a user sign in.
6.Click View Log to display the policy trace results log.
7.Click Stop Recording when you have enough information.
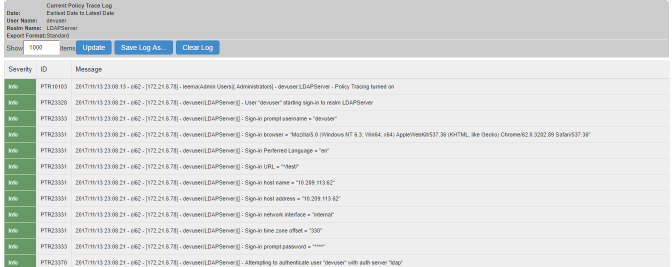
The following figure shows policy trace results:
Using the Debug Log
The Global Support Center may direct you to create a debug log to assist them in helping you debug an issue with the system. The debug log is used only by Global Support Center.
In 9.1R3 release, the last-hit timestamp is included in each debug log statement. This timestamp helps the support in debugging and correlating timings of certain critical logs in some events.
To use debug logging:
1.Select Troubleshooting > Monitoring > Debug Log to display the configuration page.
Figure shows the configuration page for Ivanti Connect Secure.
2.Complete the configuration as described in table.
3.Click Save Changes. When you save changes with Debug Logging On selected, the system begins generating debug log entries.
4.Initiate the action you want to debug, such as a user sign in. You can reset the debug log file to restart debug logging if it takes you too long to initiate the action.
5.Click Save Debug Log to save the debug log to a file that you can send to Global Support Center. You can clear the log after you have saved it to a file.
6.Clear the Debug Logging On check box and click Save Changes to turn off debug logging.
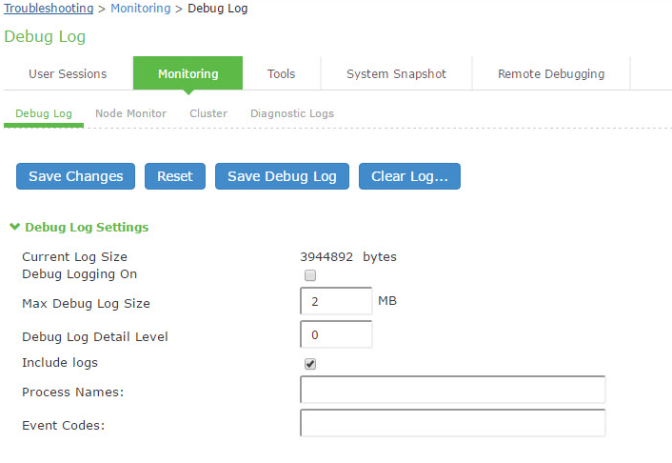
|
Settings |
Guidelines |
|
Current Log Size |
Displays the size of the current log file. If it is large, use the controls to save, reset, or clear the log file. |
|
Debug Logging On |
Select to turn on debug logging. |
|
Debug Log Size |
Specify a maximum debug logfile size. The default is 2 MB. The maximum is 250 MB. |
|
Debug Log Detail Level |
Specify the debug log detail level. Obtain this from Global Support Center. |
|
Include logs |
Select this option to include system logs in the debug log file. Recommended. |
|
Process Names |
Specify the process name. Obtain this from Global Support Center. |
|
Event Codes |
Specify the event code. Obtain this from Global Support Center. For MDM integration issues, Global Support Center typically likes to collect debugging information for codes MDM, Auth, agentman, and Realm. The text is not case sensitive. |